by UPFINA
It’s fairly obvious that when people who are unemployed stop getting the extra $600 per week from the federal government on July 25th, they will spend less unless they get their job back. Piper Sandler did a survey to give us the details on how consumers anticipate this change impacting their spending habits.
“If federal unemployment benefits of $600/week is eliminated or reduced at the end of July, how would that impact your spending behavior going forward?” – Piper Sandler survey pic.twitter.com/l7nF4uquv4
— Sam Ro 📈 (@SamRo) July 5, 2020
As you can see from the chart above, 46% of consumers would spend less than they have been if the $600 weekly benefit is reduced or eliminated. 45% would spend the same. It’s incredibly odd for anyone to spend more money when they are getting less benefits. This is close to zero though. Interestingly, only 2% of people stated they expect to get their jobs back. Obviously, if only 2% get their jobs back in July it would be a disaster. However, that low percentage is likely to do with the framing of the question. It asked about spending habits, so people didn’t consider their employment chances.
Slowing Growth
We need to wait until August to see the potential impact of the unemployment benefits ending. Keep in mind, a modest decline in jobless claims won’t make up for the income lost from the lack of benefits for the people who don’t go back to work. There needs to be a substantial increase in employment to avoid the negative. We don’t need to wait to see the impact the spike in COVID-19 cases had on the economy.
US Activity Declined in States with the Worst Virus Outbreaks in Late June and Stalled in Others (via GS) pic.twitter.com/shxyjjCG5i
— Gianclaudio Torlizzi (@TCommodity) July 5, 2020
As you can see from the chart on the left, the states with the worst COVID-19 outbreaks had the largest declines in retail and recreation activity according to the Google Mobility index. These states have stopped the improvement in the national average. When a few states reverse their opening, it impacts the rest of the country. The chart on the right suggests all states’ workplace mobility stopped improving. That suggests the people who don’t need to go to work are being cautious. If these workers can be almost as productive at home, this won’t impact most of the economy. It hurts the oil industry, but it helps the work from home companies.
Restaurant Sales Declining In Worst Hit Areas
It’s no surprise with the spike in COVID-19 cases that reservations at restaurants are falling. The chart below shows the 5 day moving average of yearly growth in OpenTable restaurant reservations. Growth peaked in the 2nd half of June. In Texas, the 4 day average from June 10th to the 13th was -47.4%. The 4 day average from July 1st to the 4th was -61.6%. The Invesco Dynamic Leisure and Entertainment ETF which measures restaurant stocks has been following this trend as it has been underperforming the overall market. Since the June 8th peak, it’s down 14% (the S&P 500 is only down 3%) as of July 2nd’s close.
Trends in seated diners as per @OpenTable (5d average) in #COVID19 hotspots not looking good pic.twitter.com/VYDXPbjp8a
— Liz Ann Sonders (@LizAnnSonders) July 6, 2020
Unusual Activity In Chinese Stock Market
There is a lot of focus on the Nasdaq because it has done so well recently. As of Monday’s close, it was up 14 of the past 16 trading days. However, the Chinese stock market is even more overbought. The Shanghai Composite rose 5.7% on Monday to the highest level since February 2018. It’s up 12.5% in just 5 trading days and 15.3% since June 15th. As you can see from the chart below, all 3 of China’s stock indexes have 14 day relative strength indexes in the 80s as they are well above the traditional overbought threshold which is 70.
🇨🇳 A front-page editorial in the CSJ on Monday said that #China’s multiple reforms and increased foreign capital have paved the way for a healthy bull market.
*Link (Chinese): https://t.co/doZvGyEEEP
*Chart from Bloomberg ⬇ pic.twitter.com/tYFZWHh1JU— Christophe Barraud🛢 (@C_Barraud) July 6, 2020
It’s very interesting to see the global/US media coverage of this rally because the headlines admit it’s just about improving sentiment rather than based on data. It’s common to hear individual investors criticize the headlines for providing a narrative for every minor move in stocks. That’s not happening here.
It appears there is a push from the Chinese government to get its stock market going which is dangerous because crashes cancel out the benefits rallies bring. It’s ironic that the goal is a healthy bull market because this is a parabolic rally. Straight vertical lines have the tendency to reverse drastically. In the short term, speculators like to take profits when they make a lot of money. In the intermediate term, when capital floods to a hot industry it creates excess competition which lowers potential returns. Think about how venture capital can destroy industries by encouraging start ups to lose money initially to gain market share.
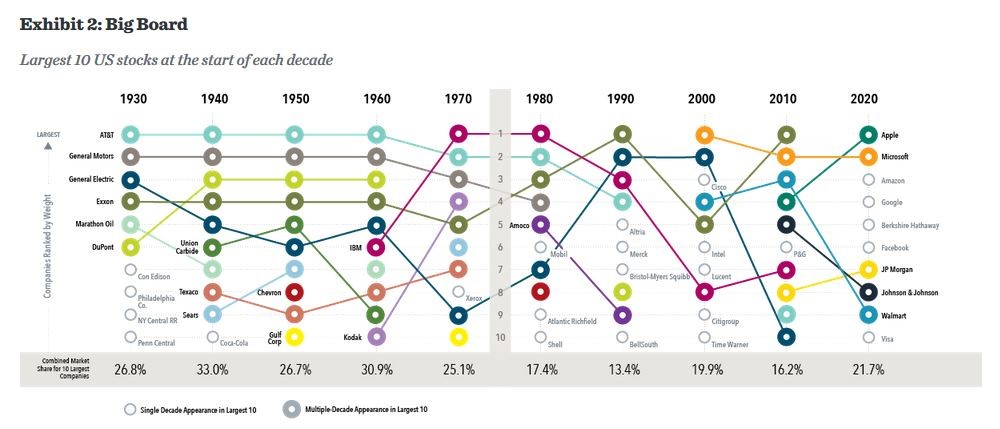
The Top 10 Leaderboard
Don’t be scared by the charts that show the current top companies as a percent of the market since the late 1970s. If you only go back that far, it makes it look like the current biggest companies have never taken up this much of the market. Once you look deeper into history, you can see, these top firms have a lower share of the market than the top firms did in most of the first half of the 20th century.
Investors must not get caught up in the day to day news. Even if you aren’t an experienced investor, you can learn from history. That’s why we are sharing the chart below which shows the changes to the list of the top 10 U.S. stocks by market cap. We are in an interesting period because 2020 has the most new companies on the list (5), yet investors are extremely confident these top businesses will be titans forever. Businesses have lifecycles, which means they always have a rise and fall. The lucky ones have a 2nd act because of innovation or an important acquisition. One example of this is Apple when Steve Jobs came back. Study the chart below and rank which companies are the most and least likely to stay on the leaderboard in the next decade.
Conclusion
The two biggest negatives for the economy are the end of the $600 federal unemployment stimulus and the spike in COVID-19 cases in a few southern and western states. We are seeing extreme buying in Chinese stocks which likely won’t last. Euphoric sentiment never lasts. It’s amazing how confident investors are in the top 10 U.S. companies, specifically the internet names, when there has recently been so much flux in the U.S. market cap leader board. Do you believe Facebook, Apple, Microsoft, Amazon, and Google will all be amongst the top 10 biggest companies in 2030?