Things are worsening quickly now.
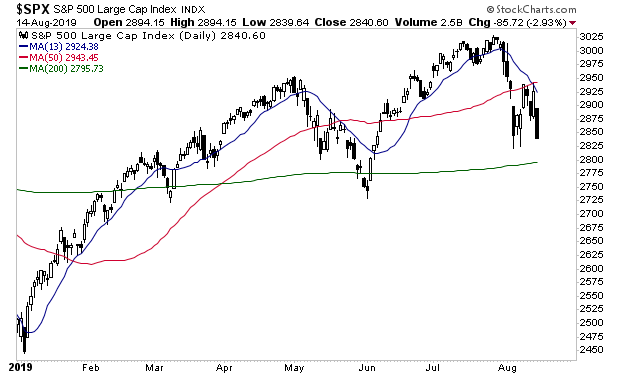
The S&P 500 has failed to recover its 50-day moving average (red line). Even worse, the 13-day moving average (blue line) has staged a bearish cross with the 50-day moving average, signaling DOWNWARDS momentum is building.

This suggests a move to the 200-day moving average (green line) at 2,800 will be occurring soon. If that line doesn’t hold, we’re in REAL trouble.
How bad?
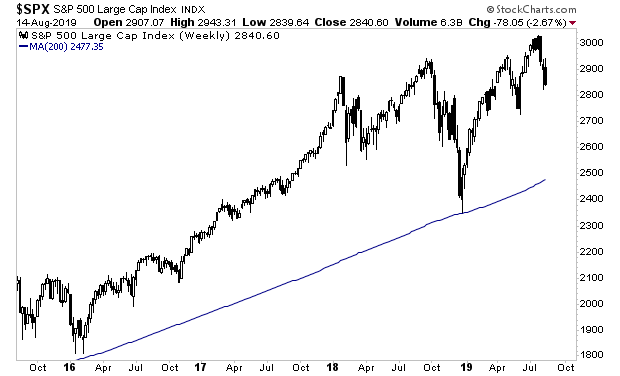
The “line in the sand” for the stock market is the 200-WEEK moving average. If we cannot hold the 200-DAY moving average, we’re heading to this line.
Unfortunately that’s where Copper, Bond Yields, and Fed Ex, all of them real-world economic indicators, indicate that stocks are heading.
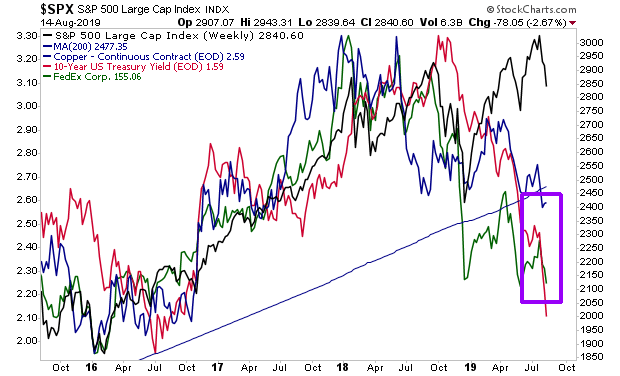
This is telling us stocks are going DOWN, possibly quite a lot.
On that note, we are already preparing our clients for this with a 21-page investment report titled the Stock Market Crash Survival Guide.
In it, we outline the coming collapse will unfold…which investments will perform best… and how to take out “crash” insurance trades that will pay out huge returns during a market collapse.
Today is the last day this report will be available to the general public.
To pick up one of the last remaining copies…
https://www.phoenixcapitalmarketing.com/stockmarketcrash.html
Best Regards
Graham Summers
Chief Market Strategist