Wolf Richter wolfstreet.com, http://www.amazon.com/author/wolfrichter
What would the Fed do if economic factors were all it looked at?
Inflation as measured by the “core” Consumer Price Index, which removes the volatile food and energy segments, jumped in August at the highest rate in 11 years, by 2.39%, a smidgen above the prior peaks of July 2018 (2.35%), February 2016 (2.33%), and April 2012 (2.32%). The last time, it rose at a faster rate was in September 2008 (2.47%):
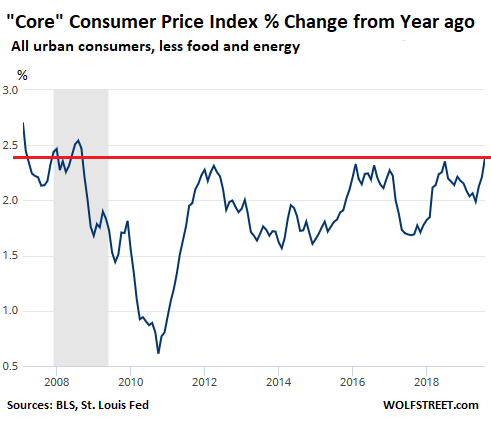
The US is currently undergoing the second oil-and-gas bust since mid-2014, or same oil-and-gas bust, with two parts separated by a sucker rally. And so energy prices, which have a weight of 7.8% in the overall CPI, dropped 4.4% from a year ago, with gasoline and diesel prices falling 7.0%.
These declines in energy prices reduced the overall CPI’s year-over-year increase from 1.81% in July to 1.75% in August, the Bureau of Labor Statistics reported this morning.
Inflation in services
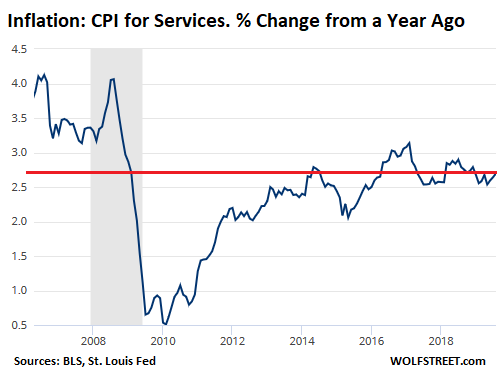
Consumers spend 70% of their money on services, which include everything from financial services and healthcare services (not medications) to broadband and cellphone services. It’s the biggie. In August, the CPI for services rose by 2.70% compared to a year ago.
“Inflation” as expressed by CPI attempts to measure the loss of purchasing power of the dollar, and not price increases due to higher-quality products.
When your broadband speed goes from 2 Mbps to 50 Mbps in the span of 10 years, but the price you pay remains the same (as was the case with our Comcast connection), you’re getting 25 times higher quality of services for the same price – meaning you’re getting more for your dollars, though you pay the same.
Inflation measures the loss of purchasing power of the dollar, and not quality improvements. This is why quality improvements are removed from the index (via the infamous “hedonic quality adjustments”). On this conceptual level, “hedonic quality adjustments” make sense.
Price changes can be divided into two portions:
- The price of quality improvements,
- The loss of the purchasing power of the dollar.
Your life gets more expensive, driven by both factors, which combined account for the overall increases in your “costs of living.” And there is a never-ending debate over the hedonic quality adjustments being purposefully applied too aggressively.
So the 2.7% increase in the CPI for services measures the loss of purchasing power of the dollar, after the impact of any improvements in your cellphone service, broadband services, data storage services and the like has been removed. The services CPI has been relatively stable since 2012:
The peculiar case of durable goods.
Durable goods are things like cars, washing machines, furniture, cellphones, and the like. Automation and other efficiencies in manufacturing, along with globalization (transferring production to cheap countries) have pushed down the costs of making goods.
The overall rule in a non-inflationary environment is that durable goods that are not improved get cheaper over time as manufacturing and distribution becomes more efficient and costs are pushed down.
But under fierce pressure from global competition, manufacturers are constantly trying to improve their product. These improvements allow them to charge more for their products, but since these improvements give you value for the increased price you pay, they’re removed from the inflation index (you know the drill, “hedonic quality adjustments”), so that CPI for durable goods just measures the purchasing power of the dollar with regards to durable goods, not the quality improvements.
So your cost of living goes up because the car now has a 9-speed transmission and better safety features, improved performance, fancier electronics on the dashboard, cameras front and back, automatic braking features, and the like. But when the costs of these quality improvements are removed, the car should have gotten cheaper due to the impact of manufacturing efficiencies and globalization.
And this is sort of what has been happening. The chart below shows the CPI for durable goods – the actual index not the percent change of the index. Note what might be the beginnings of an uptick in recent months, after years of declines:
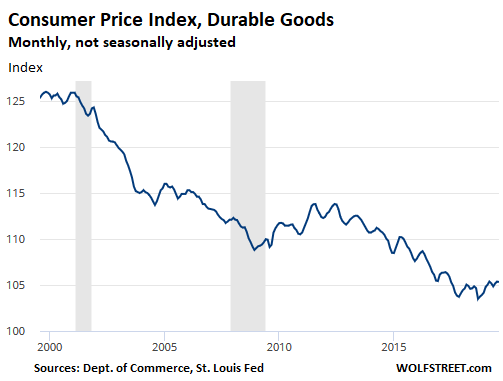
The trend of durable goods price declines in prior years has been a topic in the discussions by the Federal Reserve, also conceding that these price declines may be the normal condition in a competitive world with a constant drive to make production more efficient.
In terms of percent change, the CPI for durable goods in August ticked up 0.6% — the fastest increase since May 2012. The turnaround in the CPI for durable goods trend started toward the end of 2017, as price declines got smaller and smaller, until November 2018, when there was finally the first price increase since 2012:
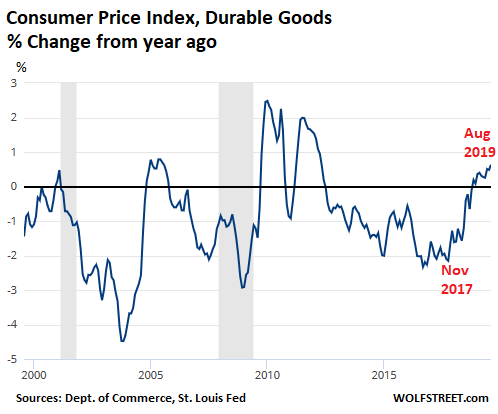
So the inflationary forces continue to be active in services, as they have been. But now these inflationary forces are also starting to push up durable goods prices for the first time in recent years.
Durable goods and services form the bulk of “core” inflation measures, including the “core” PCE measure that the Fed uses as its yardstick for its self-selected inflation target of 2%. And by the looks of it, its “low inflation” scare earlier this year, when the dollar failed to lose its purchasing power fast enough, is in the process of reversing, removing one more economic reason for further rate cuts.