Authored by Andreas Steno Larsen via Nordea Bank,
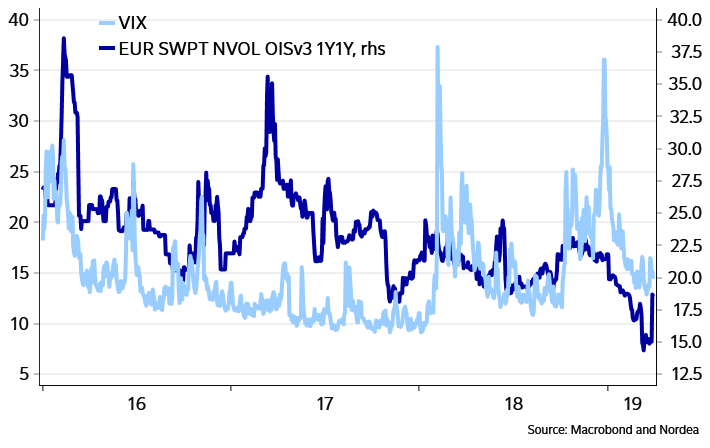
The short positioning in VIX is heavier than prior to the February and October sell-offs, which is why we are on alert to a new potential squeeze of volatility positions. From the current levels, we see the best risk/reward in long vol across assets

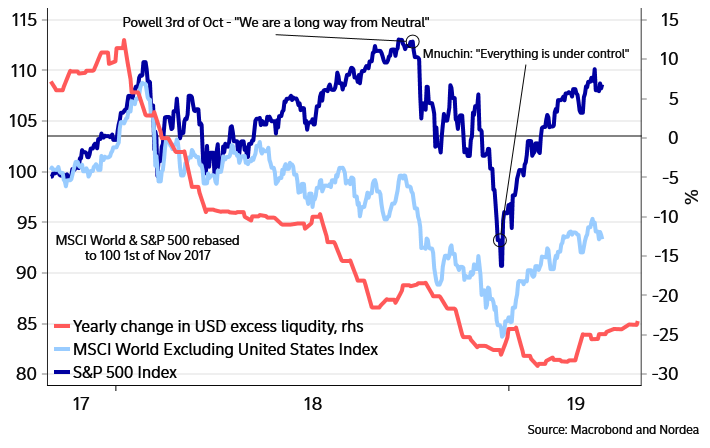
Intraday volatility in equity markets temporarily peaked over Christmas, when Steven Mnuchin released his now almost famous “everything is under control” statement. It ultimately proved to be the exact trough in equities and following peak in volatility, as Mnuchin promised that “liquidity would remain OK”. Either he anticipated that the Fed would end QT before the market expected them to or he simply referred to the liquidity influx in USDs caused by debt ceiling technicalities.
No matter the real reason, Mnuchin was right that liquidity would be better in Q1 – one of the reasons why equities have rallied, and volatility faded. It seems as if the market has bought almost aimlessly into Mnuchin’s promises, but is the liquidity outlook as benign as markets put it? Colour us doubtful. At least not benign enough to justify record short positioning in equity vol.
Chart 1: Mnuchin said that everything would be OK, and then equities boomed!
Dovish central banks have led volatility lower, but are they dovish enough?
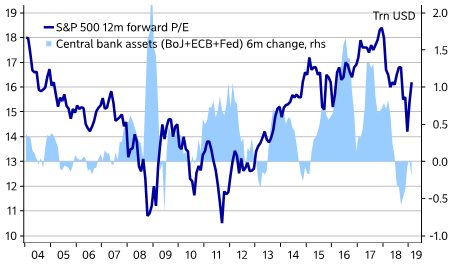
Many, if not all, major central banks have taken dovish steps through Q1, but will they prove dovish enough to keep volatility from the door for the rest of the year? The Fed has moved to end QT by October, but liquidity will still dwindle month after month in the meanwhile. The ECB has offered a new TLTRO-III on what are (probably) tougher terms than TLTRO-II. Both argue for a lukewarm liquidity development at best.
If we look at the 6-month change in central bank asset ownership, it doesn’t look supportive of a further multiple expansion. Rather the opposite. Central banks won’t directly support asset valuation over the next 6-9 months either (the asset base will still shrink).
Chart 2: Central bank assets versus forward P/E
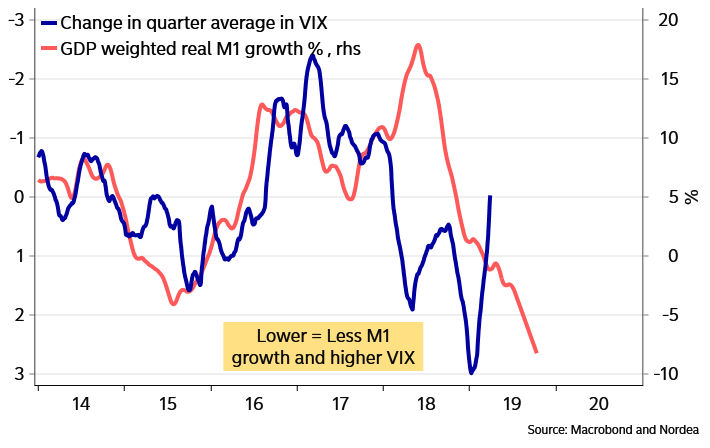
The broader liquidity trend as judged by M1 growth is also still worrisome, likely as a side effect of less benign central bank liquidity trends. Our global M1 growth indicator is also still pointing towards increasing quarter-on-quarter volatility, as slowing M1 growth and central bank liquidity leave a continuously smaller credit-cushion for markets.
Chart 3: M1 growth slows globally, usually a sign that volatility can increase
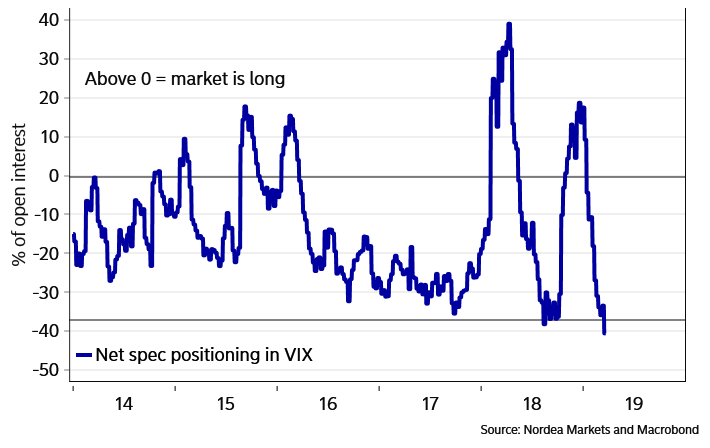
Positioning is now worrisome again …
Meanwhile positioning in short VIX has turned super short. Shorter than prior to both the February and October-December sell-offs. While a stretched short positioning in itself is not necessarily a trigger for higher volatility, it takes fewer and less severe surprises to wrong-foot market participants, when “everyone” seems to agree on a direction of lower volatility. What if the trade war or the Brexit situation suddenly explodes in a way that brings tail risks back into play? Then markets will be extremely wrong-footed.
Chart 4: Positioning is super short in VIX. A worrisome signal of (too) uniform market thinking
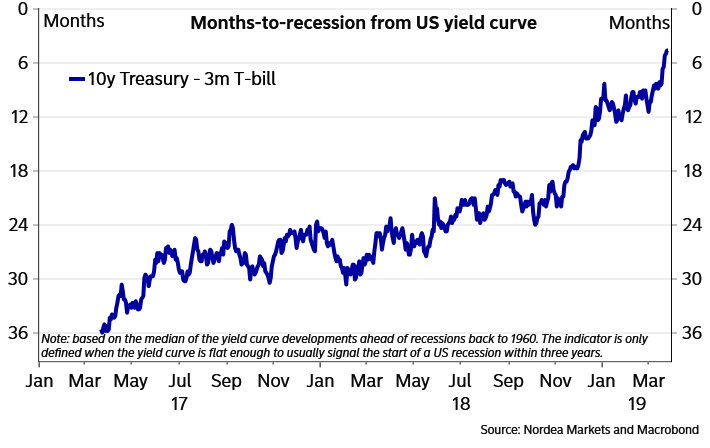
In the yield curve we trust
As is the case every time the US yield curve inverts (10yr-3months), economists start discussing with each other whether or not to trust the recession signal of the inversion. This time is no different in that regard, as several papers on why not to trust the yield curve have already been published.
If we allow the yield curve to be the sole “objective” judge on the timing of the next US (read potentially global) recession, then it is only 6-7 months away. It is hard to see how almost record-low volatility can persist in such an environment; at least if the yield curve recession hint is right. We don’t find convincing evidence why we shouldn’t trust the yield curve at all this time around either.
And even if the yield curve is wrong, then talk of whether the yield curve signal is right or not in the coming quarters could be enough to spur a spike in volatility.
Chart 5: The next recession is only 6-7 months away according to the USD yield curve
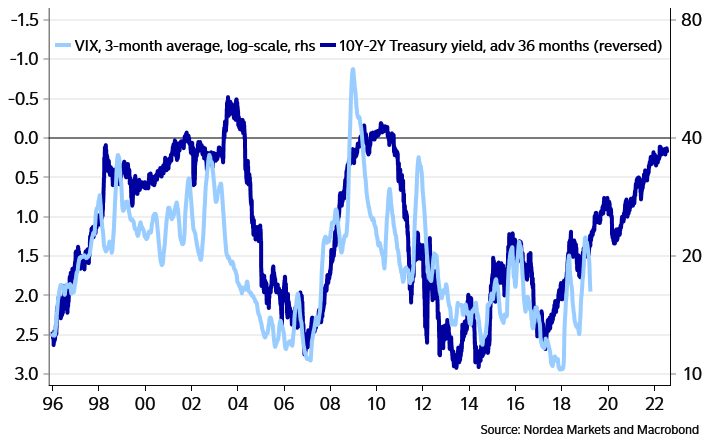
The yield curve is not only a decent forecaster of recessions; it is also a more than decent forecaster of volatility. The 10-2yr spread on the US treasury curve usually leads the average volatility by up to 3-years, and given the recent flattening of the USD curve, we only have even more volatile periods coming up, according to this relationship.
Chart 6: The USD yield curve suggests that average volatility will continue to rise over the next 1-2 years
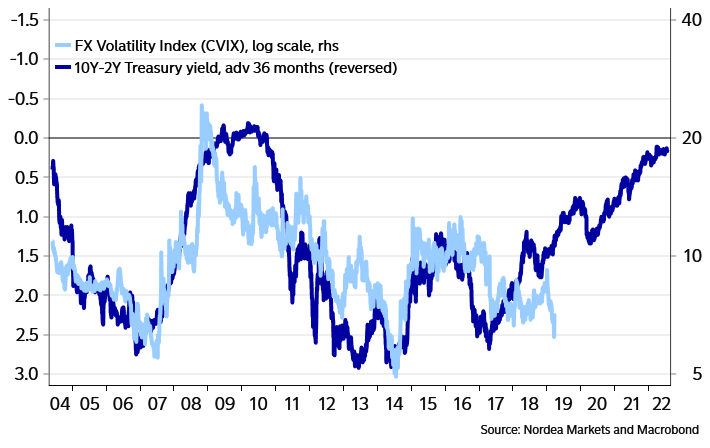
The drop in volatility in FX space due to the above-mentioned liquidity reasons from dovish central banks has been further boosted by the anticipated progress in the trade war. China and USA allegedly discussed a “cap” on USD/CNY or even a target lower than today’s spot as part of the trade deal.Calm is hence restored in USD/CNY, and CNY devaluation fears have abated. If USD/CNY is stable, then USD/ASIA pairs are usually fairly stable as well, which is why progress in the trade talks has worked to further dampen FX volatility.
FX volatility tends to follow roughly the same road map as equity volatility. Hence the current CVIX (broad FX volatility) also looks too low compared to the USD yield curve. Volatility in one asset class usually triggers volatility in other classes as well. A trade deal could help to keep FX volatility low (due to the stabilisation of USD/CNY), but probably not as low as now.
Chart 7: The yield curve also predicts higher CVIX (broad FX volatility)
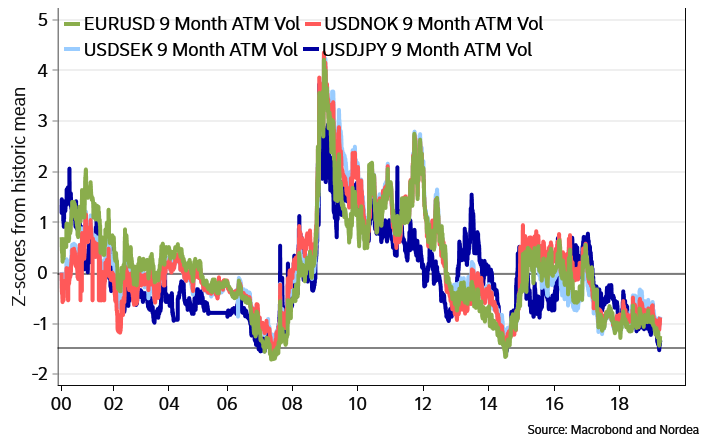
EUR/USD volatility looks cheaper than Scandi-vol compared to historical levels currently, but we often get the largest reactions in USD/SEK and USD/NOK volatility, when a cross-asset volatility spike hits the market. Across G10, volatility levels in 9-12-month tenors are 1-1.5 z-scores below a running historic mean. It would be unusual to see both USD/JPY and EUR/USD volatility cheapen further from current levels (see chart 8). We find 9-12-month volatility cheaper relative to shorter maturities.
Chart 8: USDJPY and EURUSD volatility is 1.5 z-scores below averages
It is less certain that “contagious” effects from higher volatility in other asset classes will show up in rates volatility. A potential renewed equity sell-off and consequently further slowdown in Europe and the US will probably only fuel the “Japanification” pricing of the ECB – i.e. low rates for much longer. Rates volatility is hence also the volatility class that shows the biggest resilience to the global slowdown predicted by the USD yield curve.
Chart 9: Rates volatility not as “easily” predicted by the USD yield curve

One way to play the volatility bet in rates space could be to buy a EUR receiver swaption 1y1y as a combined bet on i) higher cross-asset volatility, ii) a two-tier system from the ECB that would allow them to cut the depo-rate even deeper than the current -0.40%, subsequently opening the door for new historic lows in EUR rates (ECB Watch: Could tiering save bank profitability?).
Chart 10: A EUR receiver swaption could be a way to bet on higher volatility and lower rates