by Chris Kimble
CLICK ON CHART TO ENLARGE
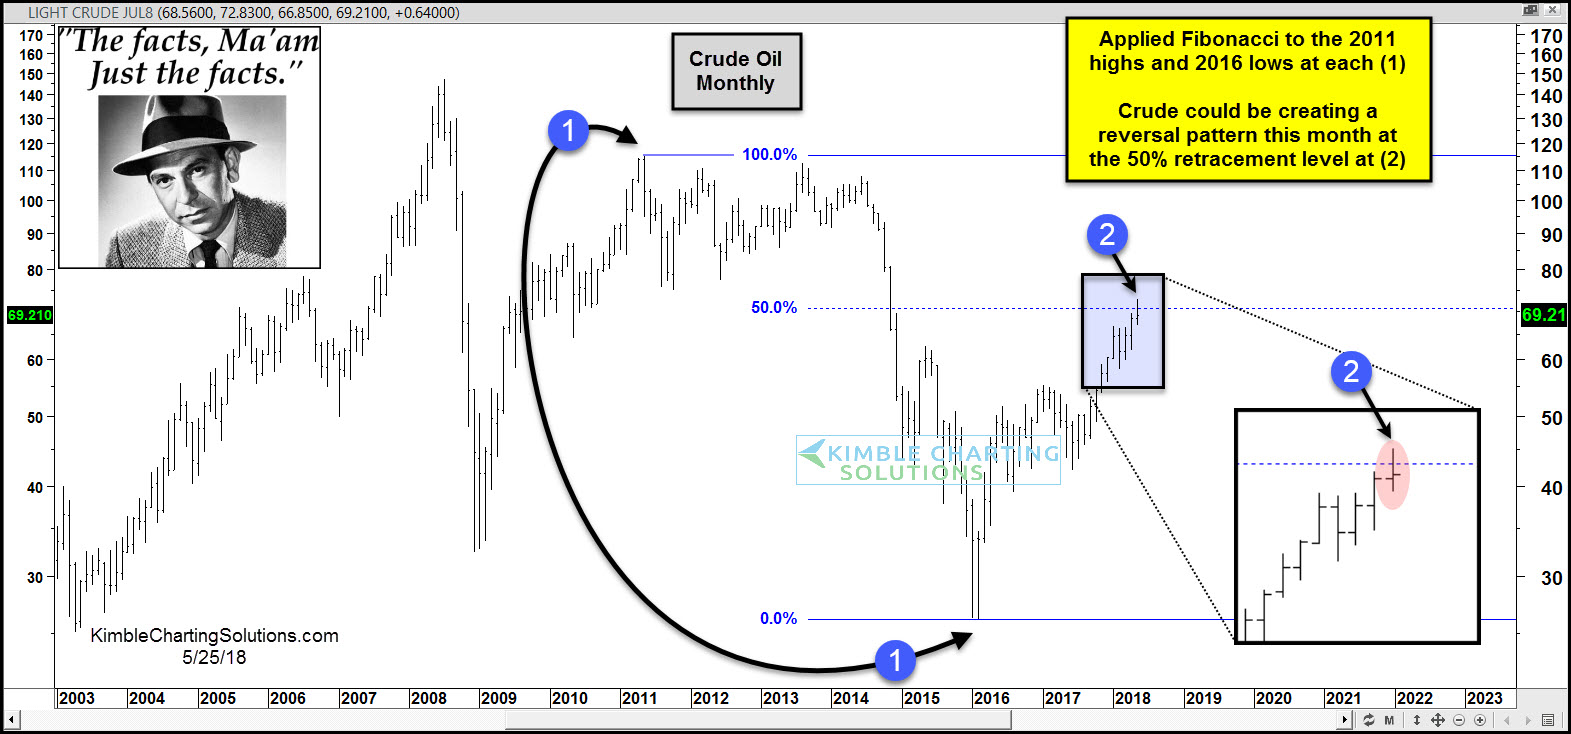
This chart looks at Crude Oil on a monthly basis over the past 15-years.
Crude experienced a large decline (75%+) from the highs in 2011 to the lows in 2016. We applied Fibonacci to this key highs and lows at each (1) above.
The rally from the lows in 2016 has Crude Oil testing the 50% retracement level of the large 5-year decline at each (2).
Joe Friday Just The Facts– Crude Oil could be creating a bearish reversal pattern this month at (2).
If Crude is topping at the 50% level, it could impact the overall commodities sector and the stock market as well.