by C Hamilton
As the old adage goes, real estate is all about location, location, location. Given this, I wanted to offer a regional and state by state view of the situation, where declining total populations, large declines among those employed, and declining under 60 year old populations are taking place parallel to a resurgence in interest rate driven home valuations and building.
First, annual change in regional total populations. Growth in all four regions is decelerating but outright declines are now underway in the Northeast and Midwest.


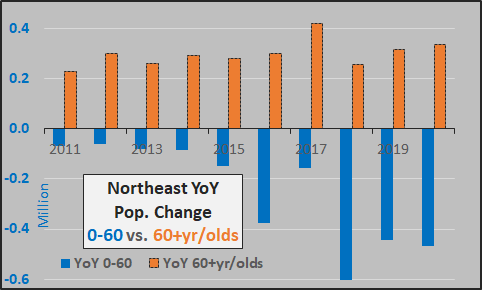
Year over year change in under versus over 60 year old population. On an annual basis, the Northeast under 60 year old population is now declining by about a half million, or equivalent to losing a city about the size of Baltimore annually. This working age depopulation reduces the quantity of potential employees, potential home buyers/renters while the quantity of elderly (potential home sellers) soars.
- declining total population
- declining under 60 year old population (potential buyers) versus soaring elderly population (potential sellers)
- large decline among employed (potential buyers/renters) and shrinking future quantity of potential employees
- record low mortgage rates
- accelerating building activity and rising number of total housing units
- rising home prices


Year over year change in Midwest under 60 versus over 60 year old population. Midwest under 60 year old population is declining by about 350 thousand annually, or equivalent to losing a city the size of Cleveland annually while the 60+ year old population grows by about the same.

- declining total population
- declining under 60 year old population (potential buyers) versus soaring elderly population (potential sellers)
- large decline among employed (potential buyers/renters) and shrinking future quantity of potential employees
- record low mortgage rates
- accelerating building activity and rising total number of housing units
- elevated but stable home prices over last decade


Year over year change in under 60 versus over 60 year old populations. Under 60 year old population now falling by about 200 thousand, or equivalent to losing a city the size of Tempe annually. Again, this accelerating deceleration is also an accelerating deceleration of potential future growth…or likelihood for outright declines among employees, consumers, homebuyers versus soaring quantities of elderly.

- decelerating total population growth
- declining under 60 year old population (potential buyers) versus soaring elderly population (potential sellers)
- large decline among employed (potential buyers/renters) and decline potential for future employment growth
- record low mortgage rates
- significantly accelerating building activity and rising total number of homes
- soaring home prices


Year over year change in under 60 versus over 60 year olds. The decelerating growth of under 60 year olds means a significant deceleration of potential employment growth, even in the South.

- decelerating total population growth
- decelerating under 60 year old population (potential buyers) versus soaring elderly population (potential sellers)
- large decline among employed (potential buyers/renters) and decelerating potential for future employment growth
- record low mortgage rates
- significantly accelerating building activity and rising total number of homes
- soaring home prices


States experiencing depopulation in 2020.

States with minimal population growth…likely moving to outright depopulation in 2021.

States still growing but with decelerating growth.

States with population growth in excess of 1%. Only Idaho and Arizona seeing accelerating growth at present.


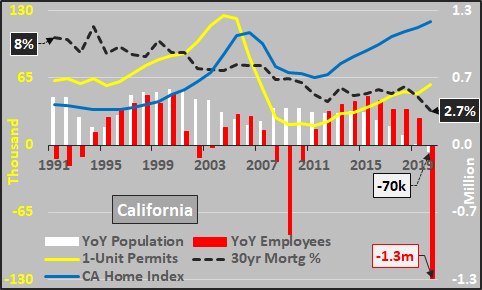
Year over year change in California under and over 60 year old population. The total population declines seen in 2020 shouldn’t have been a surprise as the inverting demographic pyramid has long been underway in California. Clearly, the total population decline will be persistent and the potential for employment growth will be limited by the declining working age population.


Year over year change in under 60 versus over 60 year old population.


Year over year change in under 60 vs. over 60 year old population.

Illinois is a poster child for the Fed’s impact on housing valuations against all organic fundamentals. Rather than the cost of shelter reflecting it’s fair market value…it reflects what the Fed and banks need it to be…otherwise the Fed and banks holding these mortgages are sitting on worthless paper that likely should be marked to zero.

What is the Federal Reserve’s role in pushing housing prices higher? The Fed sets the federal funds rate (overnight basis of lending) which is the basis for the rest of the interest rate curve. The Fed’s ZIRP (zero interest rate policy) coupled with the Fed’s purchasing of US Treasury’s and mortgage backed securities has backstopped the housing market. What private entity would buy 30 year mortgages in places that are currently experiencing depopulation and will see large scale depopulation over the lifespan of that loan??? Despite the majority of America that is either seeing outright depopulation or depopulation among under 60 year old populations…demand for housing is soaring…just like the Fed’s holdings of MBS and long Treasury bonds.

The soaring housing demand is real but for all the wrong reasons. It is not really an inadequate supply of housing but an oversupply of liquidity with a shortage of potential assets from which to earn a “safe” return. Prior to 2008, retirees and those approaching retirement would tilt their portfolios toward bonds to lessen the volatility of “riskier” stocks. But with the Fed’s decade+ of ZIRP (artificially collapsing bond / CD rates), the soaring population of soon to be retired / those in retirement turned their gaze toward RE. Demand for 5%, 6%, 7% “safe” returns provided by being a landlord replaced bonds. Foreigners, speculators, flippers all followed the rising trend.