More than plenty of supply: 6.3 Months’ unsold inventory of speculative houses.
By Wolf Richter for WOLF STREET.
Sales of new single-family houses in April dropped 6.2% from a year ago, after having dropped 11.6% in March, to a seasonally adjusted annual rate of 623,000 houses, down nearly 20% from the peak in January:
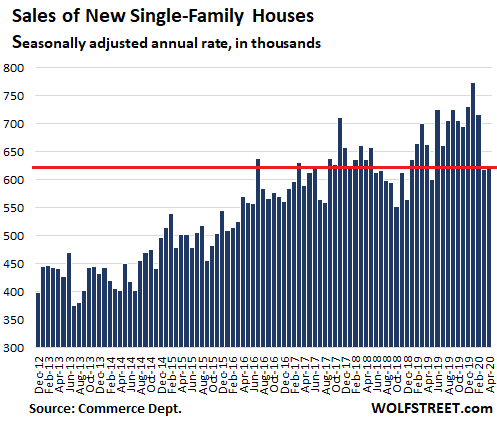
This decline in sales has occurred despite record low mortgage rates in April, with the average 30-year fixed rate dropping to 3.23% in the week ended April 30, the lowest ever, according to Feddie Mac data.
And the median price fell.
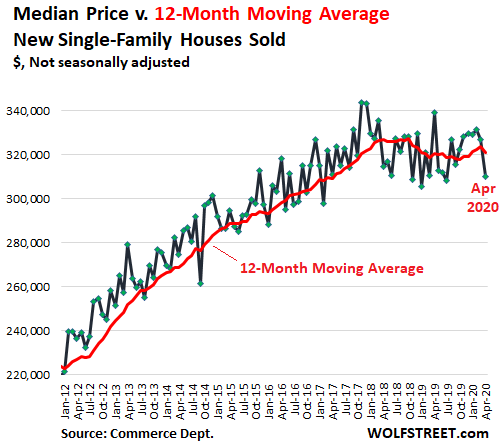
The median price of new houses in April fell 8.6% from April a year ago to $309,900, according to the Commerce Department, based on data produced jointly by the Census Bureau and the Department of Housing and Urban Development. The peak in prices occurred over two years ago in November and December 2017, at $343,000.
This median-price data is “volatile” on a month-to-month basis. The twelve-month moving average of these median prices – which indicates longer-term trends amid the volatility – smoothens out the volatility and shows a downward bias since its peak in October 2018.
The median price in April of $309,900 was the lowest median price for any April since April 2015:
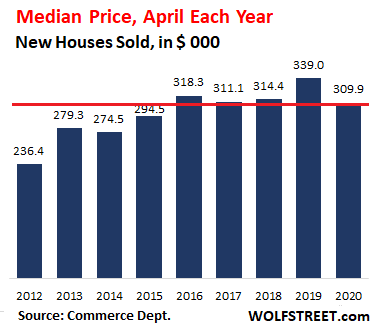
The median price – which means half of the houses sold for more, and half sold for less that month – is also impacted by the “price mix” of houses that sold in that month. If there is a larger number of lower-priced houses – lower-priced by design – in the mix that month, it helps push down the median price. The multi-year trend shows that, as an industry, builders have run into price resistance, and that they’re losing sales if they push beyond it, and in order to maintain their volume the best they can, they have to meet the market.
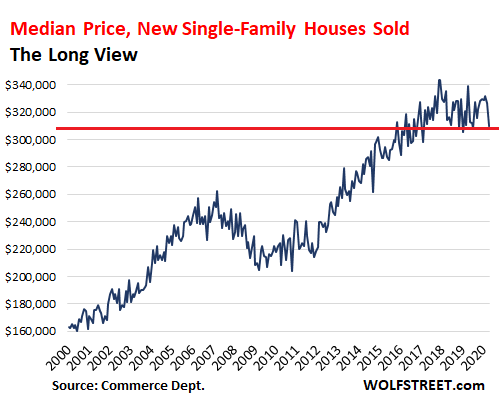
Prices of new houses had a turbulent history over the past 20 years. During the Housing Bust, the median price dropped 22% in the two years from the peak in March 2007 to the bottom in March 2009, then surged by about 55% through November 2017, to top out 31% above the peak of Housing Bubble 1, where it hit that ceiling and has since then dropped about 10%:
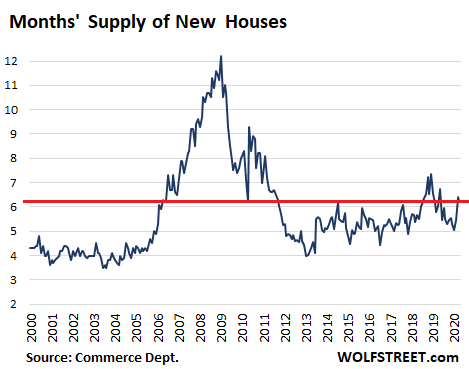
Plenty of Supply.
Inventory of new houses that have not sold yet, at 325,000 houses, was roughly flat with March, and provided 6.3 months’ supply at the current rate of sales. Four months’ supply would be more than enough for speculative houses, as it was the case before the Housing Bust – but that hasn’t been the case in years:
Homebuilders, the pros in the housing market, are not hung up for too long on aspirational prices of houses in their core segment. Unlike homeowners, they have no illusions about the market. When they build speculative houses – houses for which they have no buyers lined up yet, and that’s what the 6.3 months’ supply represents – they have to meet the market in order to sell those houses. They constantly adjust what they build, from price levels and floorplans down to the finishes. And then, they cannot sit on their speculative houses for long. They have to do what it takes to sell them. And they’re working on it.