Prices skid in the San Francisco Bay Area, Seattle, and New York. Other markets lose steam. A few power on. Crushed markets scramble to new (low) highs.
By Wolf Richter for WOLF STREET.
“The boom and bust patterns of home price growth in the West appear to be now solidly on the bust side,” said Ralph McLaughlin, deputy chief economist for CoreLogic, in a statement about today’s release of the firm’s Case-Shiller Home Price Index. So here we go.
San Francisco Bay Area House Prices
House prices in the five-county San Francisco Bay Area – the counties of San Francisco, San Mateo (northern part of Silicon Valley), Alameda and Contra Costa (East Bay), and Marin (North Bay) – fell 0.6% in September from August and were down 0.7% from the same month a year ago, according to the S&P CoreLogic Case-Shiller Home Price Index today. The index is now back where it had first been in May 2018:
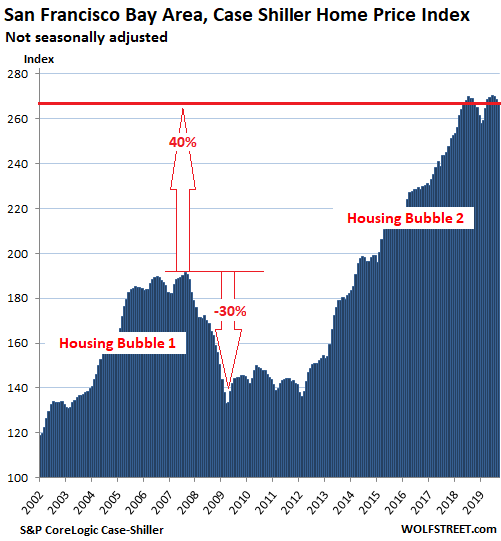
This is a veritable debacle for the news media, which, in cahoots with the real-estate industry, had endlessly hyped the assertion that the flood of IPO startup millionaires would inflate the Bay Area housing market even further in 2019 and going forward, which I pooh-poohed with gusto earlier this year. So where are those IPO millionaires? Well, they’ve been millionaires before the IPOs and already bought homes in prior years, and drove up prices back then. Duh!
The Case-Shiller Index is a rolling three-month average. Today’s release represents closings that were entered into public records in July, August, and September. The index was set at 100 for January 2000. San Francisco’s index value of 267 means prices in the metro have soared 167% since January 2000.
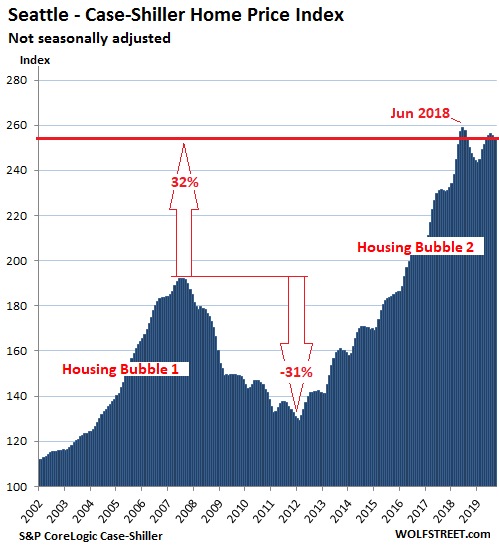
Seattle House Prices:
House prices in the Seattle metro ticked down 0.3% in September from August, and where down 1.7% from the peak in June 2018, and were below where they’d first been in May 2018:
All charts here are on the same scale, with the vertical axis going from 100 to 290. The exception is Detroit, which we’ll get to in a moment. In markets where house prices have not soared as much as they have in San Francisco, Seattle, Los Angeles, or Miami, there is more white space above the curve. This shows that there is no “national” housing market – and no “national” housing bubble. All markets are local. The bubbles are local too. And some markets, while scrambling higher, remain at crushed levels.
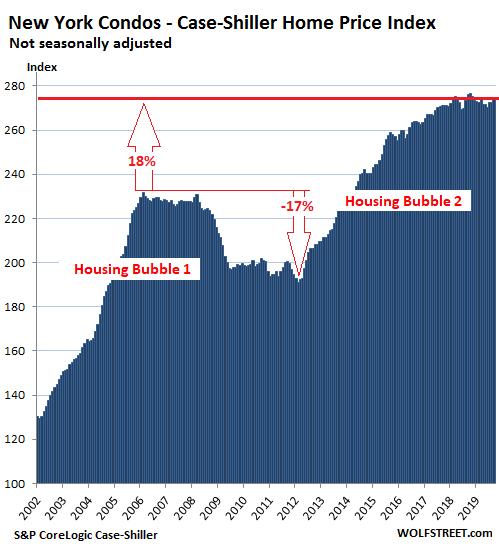
New York Condo Prices:
The Case-Shiller Index uses standard Metropolitan Statistical Areas for many of its city indices. But its index for New York City is based on a custom area covering numerous counties in the states of New York, New Jersey, and Connecticut “with significant populations that commonly commute to New York City for employment purposes.”
Condo prices in the vast New York City metro rose 0.8% in September from August, but were down 0.5% from September 2018, were back where they’d been in February 2018, and were up only 1.2% from September 2017:
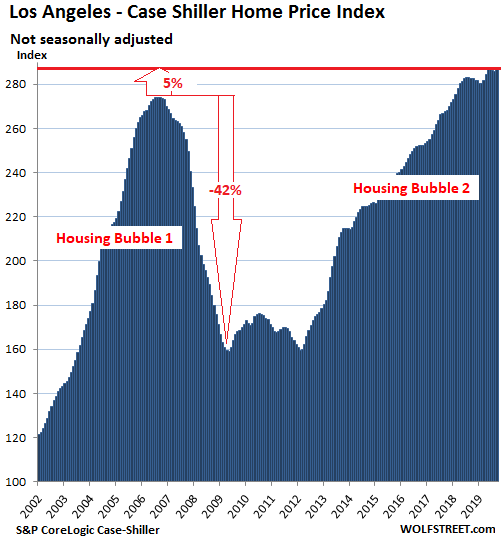
Los Angeles House Prices:
House prices in the Los Angeles metro rose 0.5% in September from August and were up 1.7% year-over-year – but have been nearly flat for five months:
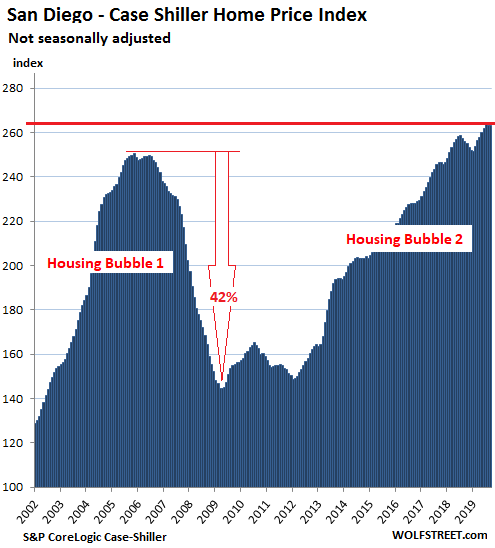
San Diego House Prices:
House prices in the San Diego metro ticked up 0.1% in September from August, were essentially flat for three months, and were up 2.8% year-over-year:
The methodology of the Case-Shiller Index is based on “sales pairs.” It compares the sales price of a house that sold in the current month to the price of the same house when it sold previously. This solves some problems other indices have: Unlike “median price” indices, it’s not impacted by “mix”; and unlike “average price” indices, it’s not impacted by a few big outliers.
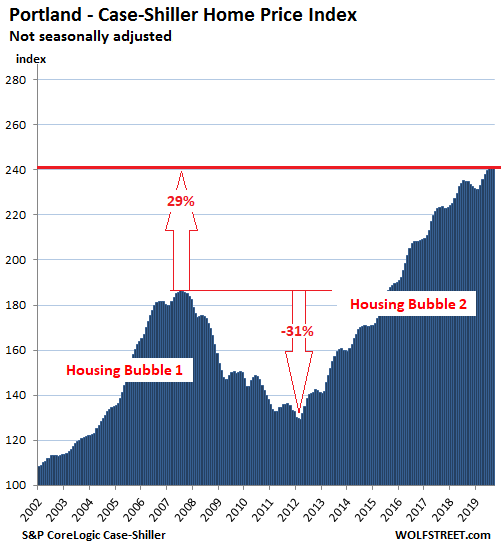
Portland House Prices:
In the Portland metro, house prices were flat in September compared to August, were flat for the past three months, and were up 2.7% from September last year. Note how the white space above the curve is getting larger as house prices have not soared quite as much since 2000 as in the markets above:
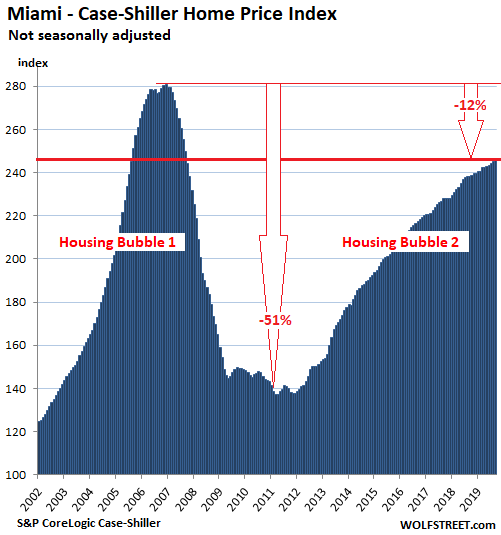
Miami House Prices:
In the Miami metro, house prices ticked up 0.3% in September from August and 3.1% from September last year, but remain down 12% from their dazzling nuttiness at the end of 2006:
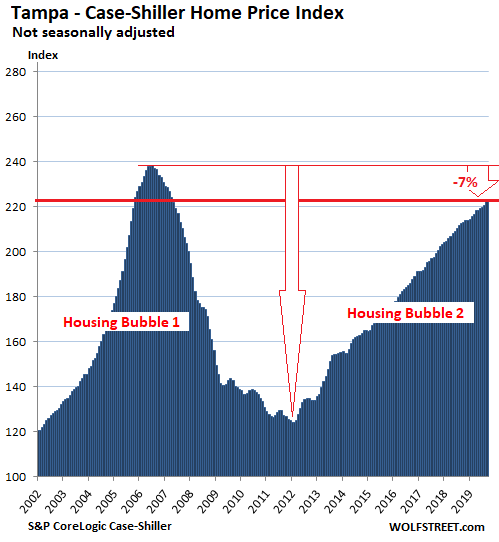
Tampa House Prices:
The Case-Shiller index for the Tampa metro rose 0.7% in September from August and was up 4.5% year-over-year. The index remains 7% below the housing-insanity culminating in 2006:
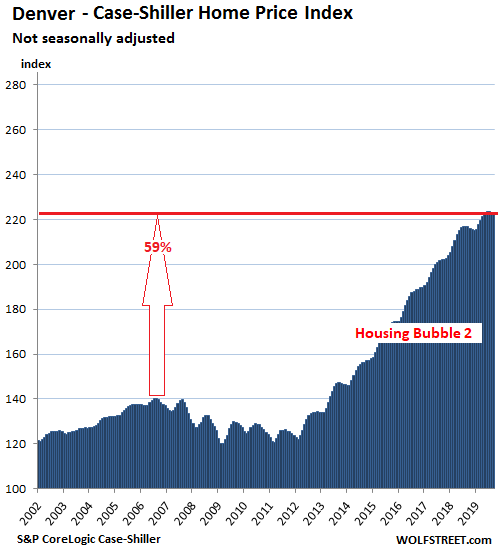
Denver House Prices:
The Case-Shiller index for the Denver metro ticked down 0.1% in September from August, was up 3.0% from a year ago, but was essentially flat for the past five months:
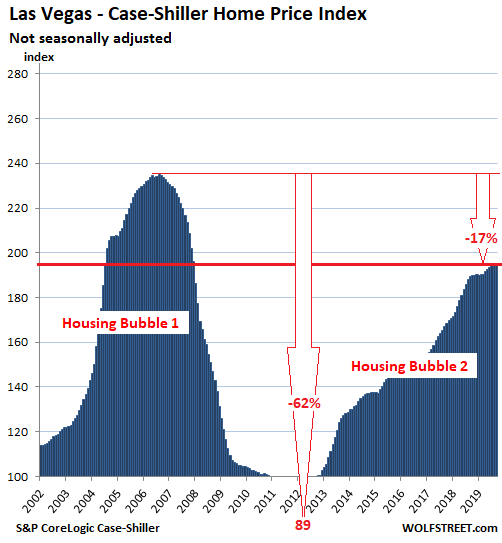
Las Vegas House Prices:
In the Las Vegas metro, house prices in September were flat for the past three months, which whittled down the year-over-year gain to 2.9%, the smallest year-over-year gain since August 2012, after a long series of double-digit surges:
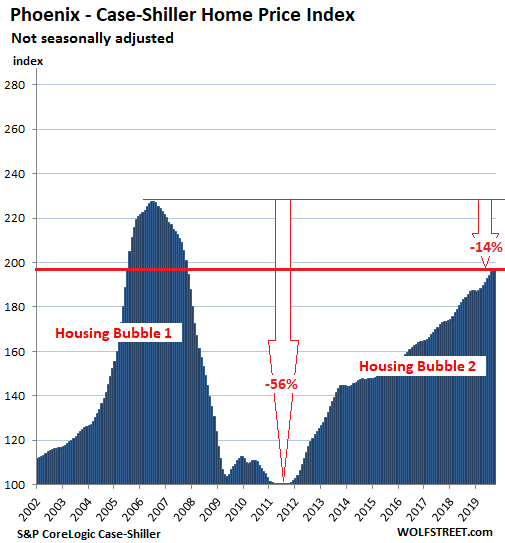
Phoenix House Prices:
In the Phoenix metro, house prices ticked up 0.5% in September from August and were up 6.0% from last year, with a new housing bubble trying to recapture peak nuttiness of 2006:
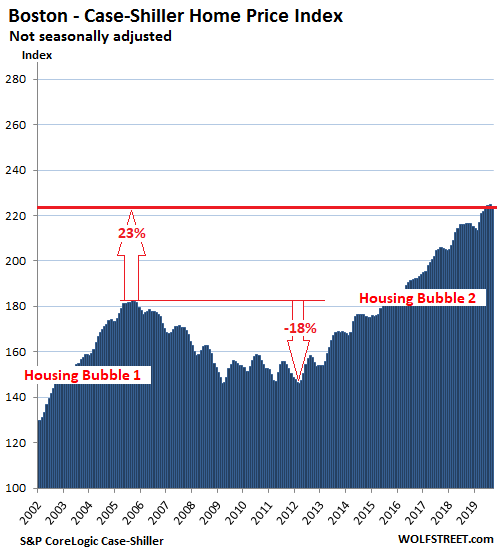
Boston House Prices:
House prices in the Boston metro fell 0.4% in September from August, were up 3.5% from a year ago, and are down a tad from four months ago:
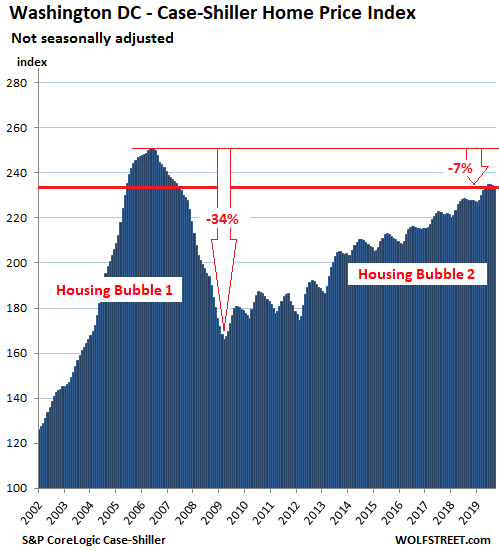
Washington DC:
House prices in the Washington D.C. metro ticked down in September from August and were back where they had been in May, but were still up 2.7% year-over-year. The index remains 7% below the peak in 2006:

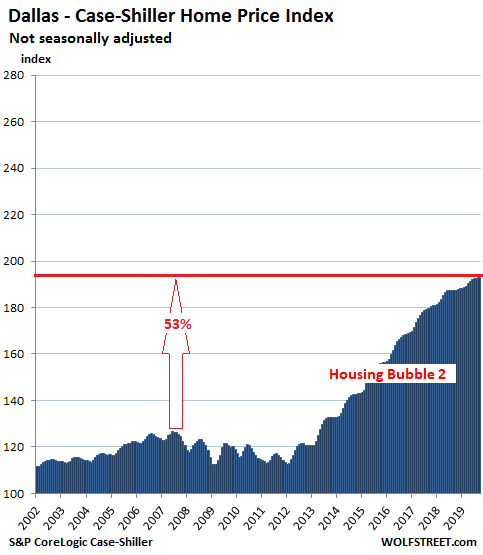
Dallas-Fort Worth House Prices:
In the Dallas-Fort Worth metro – counties of Collin, Dallas, Delta, Denton, Ellis, Hunt, Johnson, Kaufman, Parker, Rockwall, Tarrant, and Wise – the relentless house price increases since 2012 are becoming less relentless. In September, house prices ticked up 0.2% from August, after having been flat in August, and are up 3.0% year-over-year:
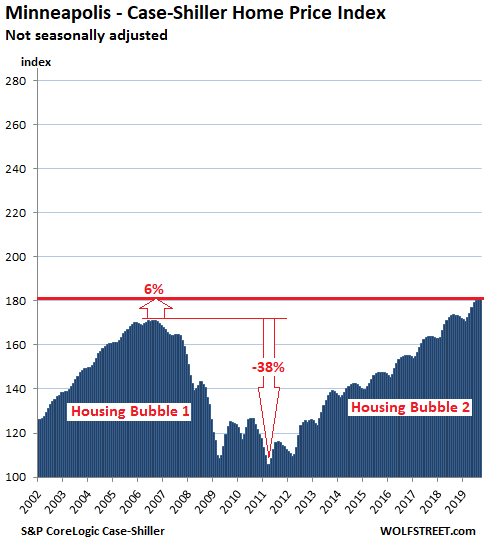
Minneapolis house prices:
In the Minneapolis metro, house prices ticked up 0.1% in September from August, and were essentially flat for the past three months. Year-over-year, prices rose 4.2%:
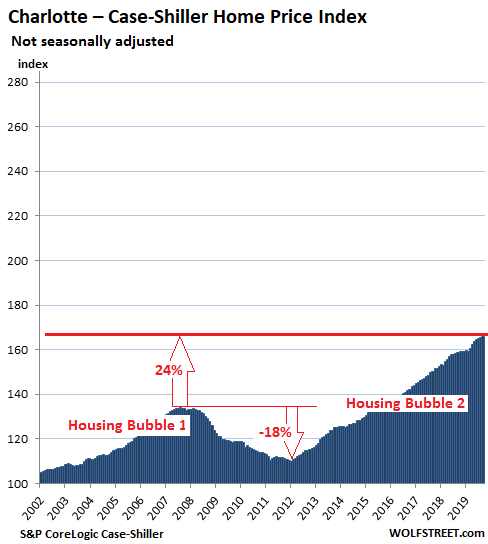
Charlotte house prices:
House prices in the Charlotte metro rose 0.3% in September from August and 4.6% from a year ago:
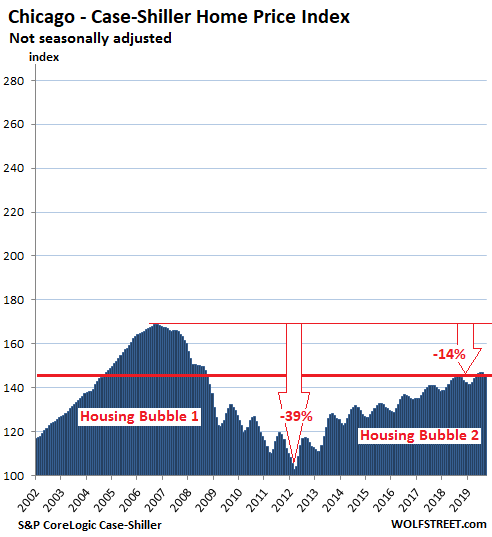
Chicago House Prices:
In the Chicago metro – counties of Cook, DeKalb, Du Page, Grundy, Kane, Kendal, McHenry, and Will – house prices fell 0.7% in September from August, which whittled down the year-over-year gain further to just 0.6%:
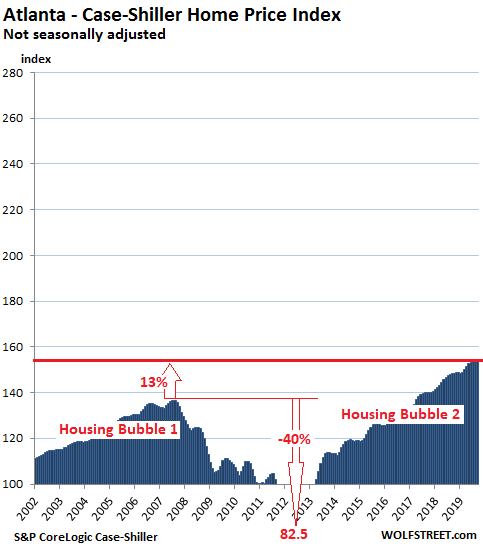
Atlanta house prices:
House prices in the Atlanta metro edged up 0.2% in September from August and rose 4.0% year-over-year, the smallest such gain since September 2012, when Atlanta emerged from Housing Bust 1, during which the Case-Shiller index had plunged 40% to a value of 82.5, taking it back to 1996:
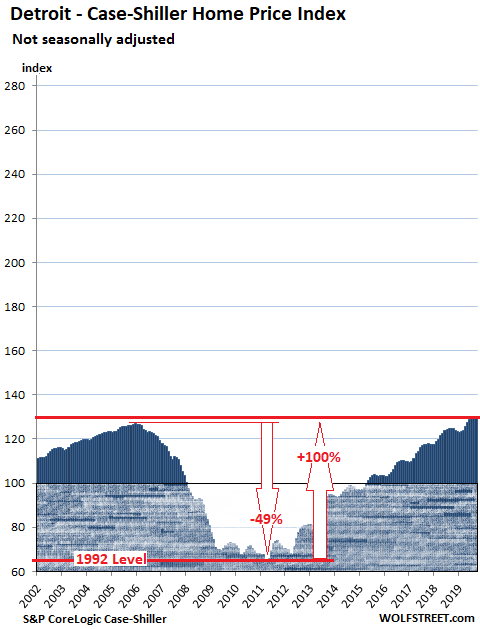
Detroit house prices:
In the Detroit metro – the counties of Lapeer, Livingston, Macomb, Oakland, Saint Clair, and Wayne – house prices were flat for the past three months, and were up 3.6% year-over-year. They’re sitting at an all-time record, surpassing by 1.7% the old record of December 2005.
Because house prices plunged nearly 50% from already low levels during Housing Bust 1, the index sank way below 100, and I have extended the chart to show the area blow 100 (shaded). From that bottom prices have since doubled:
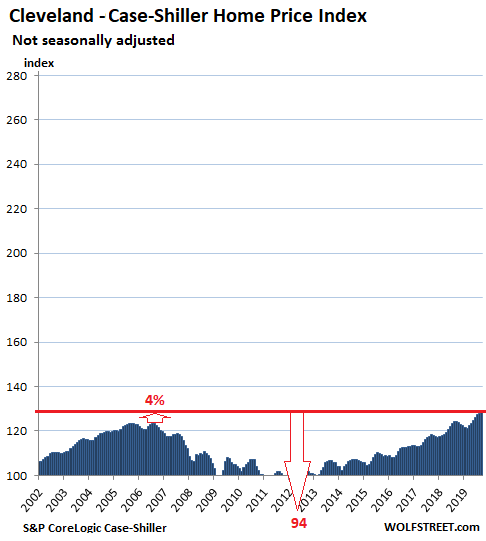
Cleveland house prices
In the Cleveland metro, house prices rose 0.5% in September from August and 3.2% year-over-year, to a new record, now up 4% from the old record of 2006. Since January 2000, the Case-Shiller Index for Cleveland has risen 28%, the smallest such increase among the 20 metros covered by the Case-Shiller Index:
A measure of house price inflation.
By comparing the sales price of a house in the current month to the price of the same house when it sold previously, the Case-Shiller index tracks how much more it costs to buy the same house over time. In other words, it tracks the purchasing power of the dollar with regards to houses in various markets, which makes it a measure of “house-price inflation” specific to those markets. So when the index shows that prices in San Francisco shot up 167% in 19 years, it means that in that market, the dollar’s purchasing power with regards to houses has gotten crushed.