
- Market Review
- Did Something Just Break?
- Sector & Market Analysis
- 401k Plan Manager
Follow Us On: Twitter, Facebook, Linked-In, Sound Cloud, Seeking Alpha

Market Review
In last week’s missive I stated:
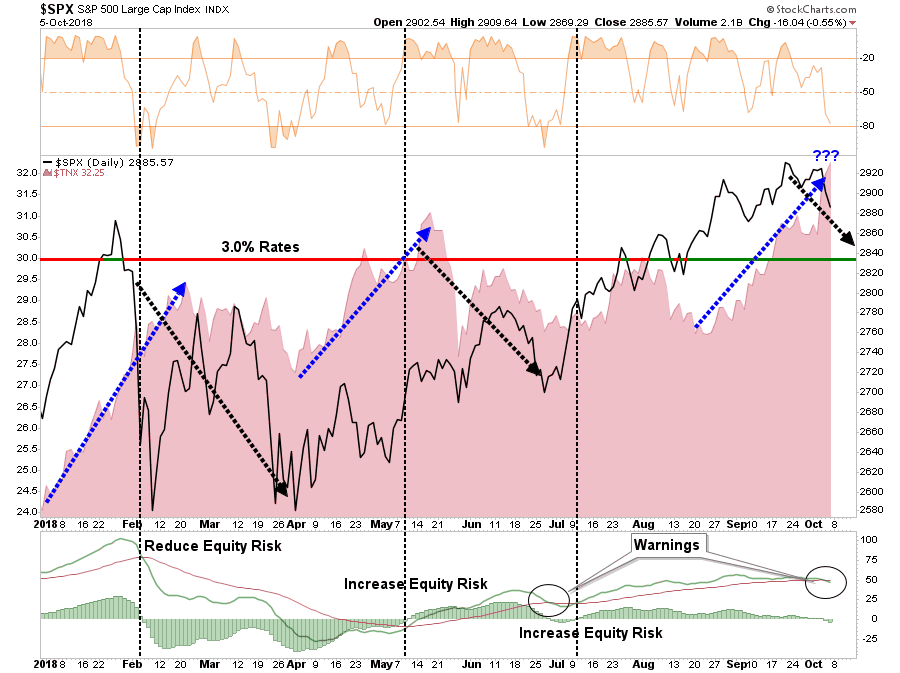
“There has been a pretty well defined upward trendline (gold box) since the April lows which has consistently provided better entry opportunities to increase equity exposure.”

“As stated, our existing portfolios are currently fully weighted toward equity risk as there seems to be little which can derail this market currently. We have moved stop-loss levels up to recent lows, added some defensive positioning, and have added bonds as rates have climbed above 3%.
Speaking of rates, each time rates have climbed towards 3%, the market has stumbled.”
Chart updated through Friday close.
I got lot’s of emails early last week suggesting “this time was different.” Rates were rising because of strong economic growth and as such, it wouldn’t affect the stock market. (More on this in a moment.)
If you note in the chart above, a short-term “warning signal” has been triggered which suggests that if rates remain above 3%, stocks are going to continue to struggle. The last time this occurred was in May when rates popped above 3%, stocks struggled and bonds outperformed.
Over the last couple of weeks, I have noted that after increasing equity exposure in portfolios, the short-term overbought condition needed to be resolved before the markets could make a year-end push higher to 3000.
Not surprisingly, the statement triggered a lot of questions as to why, at a time when the market was at 2950, I was only giving the markets 50-points of upside? The reason was that a pullback was needed to open up the potential for a year-end push. On Thursday and Friday, as the markets woke up to the recent surge in rates above 3%, markets sold off back to support at the January breakout highs. That sell-off does provide enough of an oversold condition to support a year-end push which has now expanded from just 1.6% last week, to 3.33% over the next couple of months.
I also noted last week, that we would be updating our pathway chart, as first shown above, which has remained unchanged for well over a month (prices have been updated through Friday’s close.) What was most surprising to me was how closely the markets had traced out the projected #2a pathway.
With this background, we can update the pathways which hold the highest probable outcomes over the next couple of months.

There has been a pretty well defined upward trendline (gold box) since the April lows which has consistently provided better entry opportunities to increase equity exposure. While there are literally thousands of potential outcomes over the next couple of months, I have refined what I think are the most likely outcomes down to four possibilities.
Pathway #1: The market sold off to the peak of the January highs which is support. With the market now short-term oversold a rally to new highs through the end of the year is possible (20%)
Pathway #2a: The first of two most probable outcomes at this juncture is a rally from the current support at the January highs but the rally fails at 2900 which forms the right should of a “head and shoulder” topping pattern from the August left shoulder peak. The bullish outcome is a selloff back to the January highs and the market then rallies to new highs by year end. (40%)
The bearish outcome, is a violation of the “neckline” at the January highs and the market continues to track Pathway #2b
Pathway #2b: Rising interest rates continue to weigh on stocks next week and the market breaks the January high support level. However, given the short-term oversold condition, the market rallies from the bottom of the current bullish trend (gold box) but fails to rise above the January highs and turns lower putting in a more major top for the year. (30%)
Pathway #3: The issue of rising interest combines with a break in the economic data, or another credit-related event, and sends the market heading back to test supports at 2800 and 2750. This would likely coincide with a more severe contraction in the economic data which is not an immediate threat. Nonetheless, we should always consider the risk of an unexpected, exogenous, event. (10%)
Next week, I would expect to see a rally from the short-term oversold conditions. However, it will be the breadth and strength of that rally that will be important to watch.
If it is a weak, narrow bounce with little conviction, we will use the rally to lift positions, trim losers, raise cash and potentially look at initiating some hedges.
Our bigger concern remains interest rates simply for one reason – you can NOT have higher stock prices AND higher interest rates. Period.
One or the other will have to give.
Did Something Just Break?
Over the last few days, the internet has been abuzz with commentary about the spike in interest rates. Of course, the belief was that rising rates were “okay” because the market was still rising. As noted on Wednesday by Charlie McElligott (via Zerohedge):
“Effectively the market is saying that in the absence of an ‘inflation shock’ (which would drive a front-end yield spike / ‘power flattening’ on ‘accelerated Fed),’ that we are on track to ‘grow faster than we are tightening’
Another way of putting it is that Wednesday’s ‘economic assessment upgrade’ and view that we are ‘growing faster than we are tightening’ is why we are not seeing that same ‘rate – and VaR shock’ contagion into risk-assets that defined the market in late January, early February, and which – as McElligott notes – ‘was BY-FAR the #1 client inquiry, i.e. ‘Why are higher yields not negatively impacting Stocks here?.’”
On Thursday and Friday, stocks crumbled as the reality that higher rates and tighter financial conditions will begin to negatively impact growth data. With housing and auto sales already a casualty of higher rates, it won’t be long before it filters through the rest of the economy.
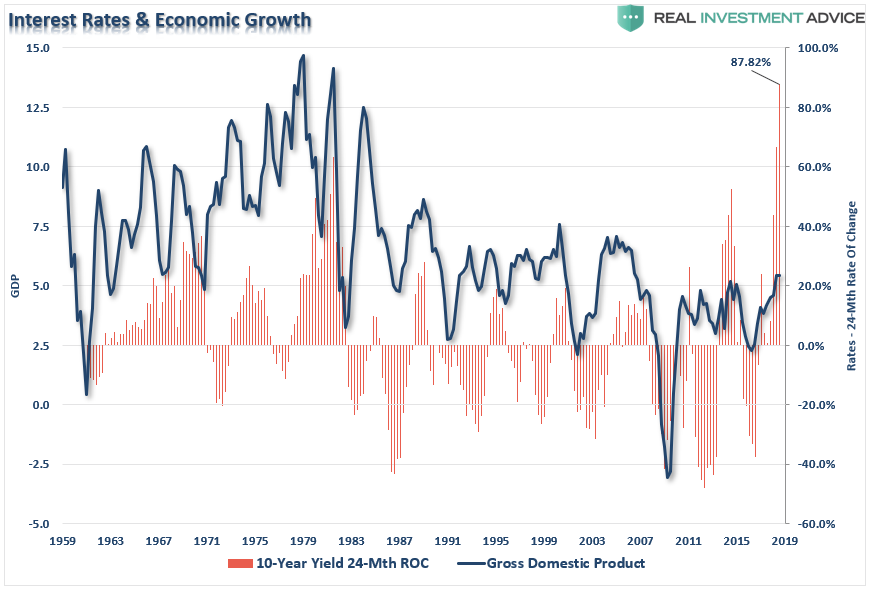
The chart below shows nominal GDP versus the 24-month rate of change (ROC) of the 10-year Treasury yield. Not surprisingly, since 1959, every single spike in rates killed the economic growth narrative.
As Doug Kass noted on Friday:
“No, it’s not the economy, stupid. It’s interest rates, stupid.
Their course and trajectory have had a profound influence over time on our markets.
For as James Carville also famously stated in emphasizing the potency of the bond market:
“I used to think that if there was reincarnation, I wanted to come back as the president or the pope or as a .400 baseball hitter. But now I would like to come back as the bond market. You can intimidate everybody.”
Precisely when that rate influence ‘bears’ on our markets is always hard to ascertain.
Perhaps with the benefit of hindsight, we over thought what factors ultimately would debilitate the capital markets.
Perhaps concerns over possible policy issues and or policy mistakes, never-ending political surprises, continued sovereign debt crises, and other issues were simply decoys.
Perhaps it was in front of us all the time, just as it has been in almost every meaningful markdown in history.
In a global economy that never has been more flat, interconnected and filled with multiple and interrelated dominoes, the process of a quickened rate rise becomes ever more problematic in a mountain of public and private debt as the winter cold descends upon us.”
He is absolutely correct.
In the U.S. we have dismissed higher rates because of a seemingly strong economy.
However, that “strength” has been a mirage as I noted last week:
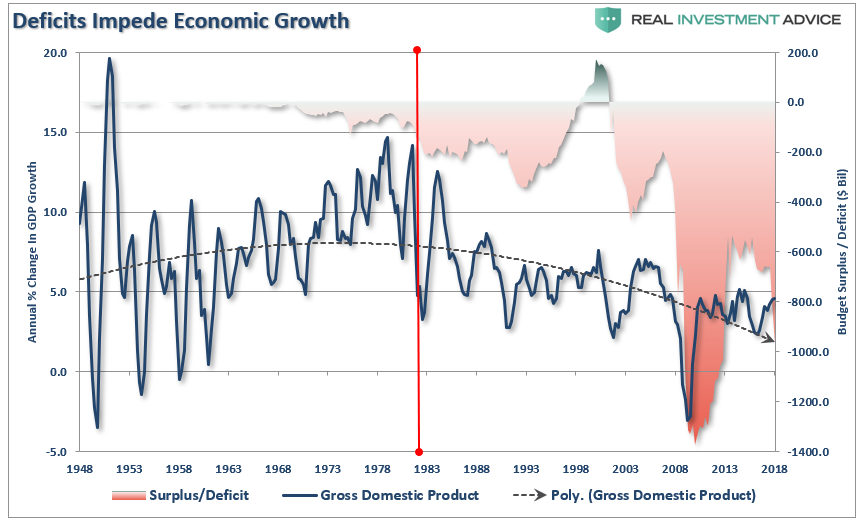
“While the markets have been the beneficiary of the tax cut legislation, which gave a short-term boost to corporate profitability, the economy has enjoyed a boost from the massive increases to spending from what should have been more aptly termed the ‘Bipartisan Non-Budget Act of 2018.’ Notice in the chart below the pickup in economic activity has coincided with a surge in the deficit. Spending on natural disasters and defense simply ‘pulls forward’ future economic growth which gives an illusion of an economic turn.”
That illusion of economic growth has kept investors blind to the economic slowdown which is already occurring globally. As Mehul Daya and Neels Heyneke via Nedbank recently penned:
“Global bond yields are on the rise again, led by the US Treasury yields, which as we have highlighted in numerous reports, is the world’s risk-free rate.
The JPM Global Bond yield, after being in a tight channel, has now begun to accelerate higher. There is scope for the JPM Global Bond yield to rise another 20-30bps, close to 2.70%, which is the ‘Rubicon level’ for global financial markets, in our view.
If the JPM Global Bond yield rises above 2.70%, the cost of global capital would rise further, unleashing another risk-off phase. Our view is that 2.70% will hold, for the time being.
We believe the global bond yield will eventually break above 2.70%, amid the contraction in Global $-Liquidity. A stronger US dollar and the global cost of capital rising is the perfect cocktail, in our opinion, for a liquidity crunch.”

“Major liquidity crunches often occur when yield curves around the world flatten or invert. Currently, the global yield curve is inverted; this is an ominous sign for the global economy and financial markets, especially overvalued stocks markets like the US.
The US economy remains robust, but we believe a global liquidity crunch will weigh on the economy. Hence, we believe a US downturn is closer than most market participants are predicting.”
I agree.
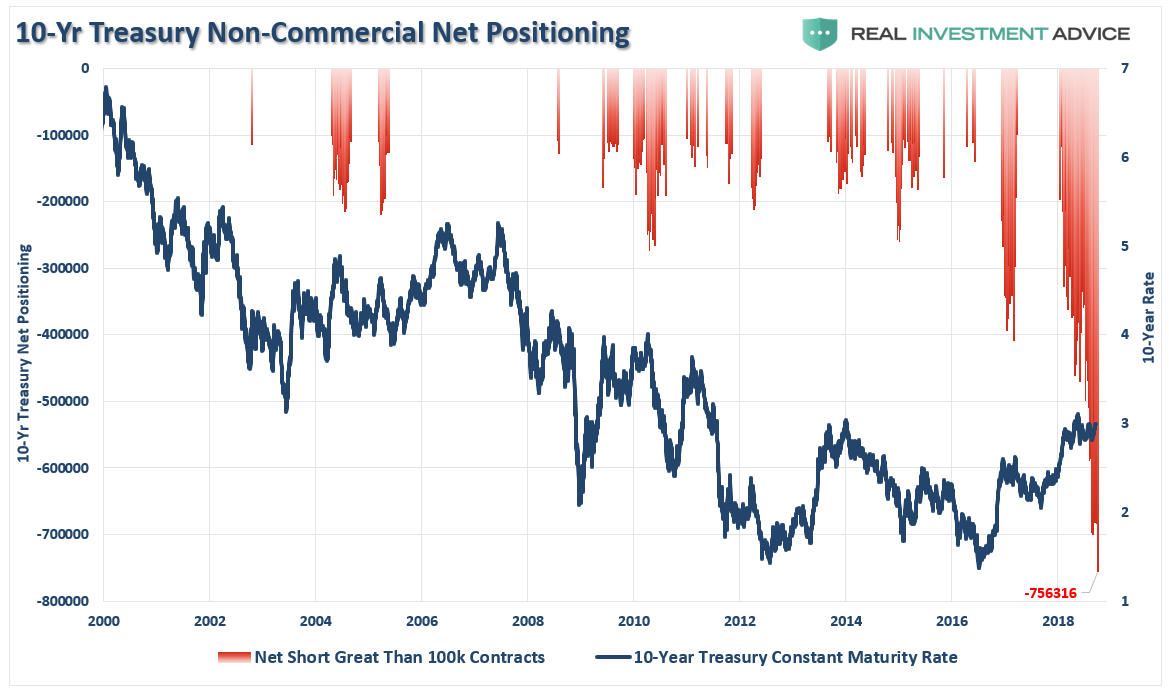
And if they are right, this is going to leave the Federal Reserve in a tough position of having tightened monetary policy to much. With bond traders more short than at any point in history, the ultimate “reversion to the mean” in Treasury’s will drive rates towards zero.
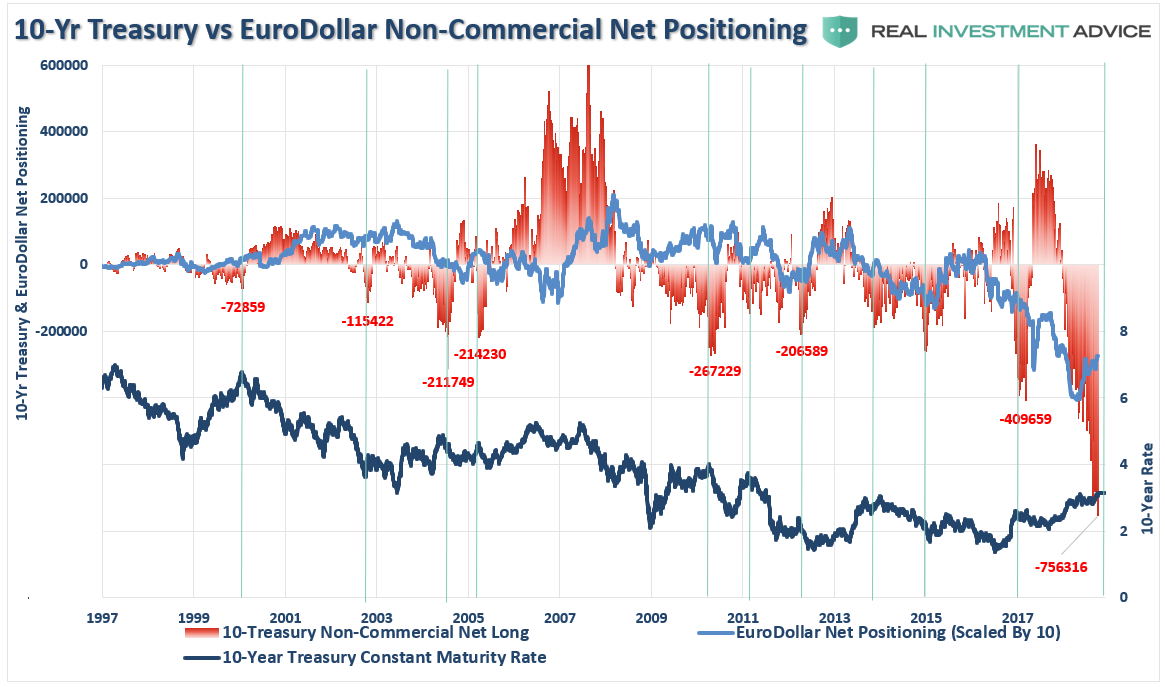
The chart below strips out all periods EXCEPT where net-short bond positions exceeded 100,000 contracts. In every case, interest rates turned lower.
Back to Doug Kass for a moment:
“The disproportionate role of quant strategies also represents a profound market risk when rates are advancing, particularly relative to consensus disinterest and even lack of understanding of the role of this dominant market player. This is important, because if the correlations that underpin risk parity begin to fail — basically when both bonds and stocks fall simultaneously — as they have in the last week, they likely will cause an impactful unwind of risk-parity portfolios that are sizable and very leveraged.”
The recent blow out in risk parity, as noted by a surge in volatility, is evidence that something likely just broke.
History bears this out as well.
Whenever the 10-year yield has traded at, or above, 2-standard deviations above the 2-year moving average, bad things have tended to occur from recessions, to corrections, to outright crisis. Given the 2-year rate of change on the 10-year has surged to the highest level in over 50-years – if something hasn’t already broken, it likely will soon.

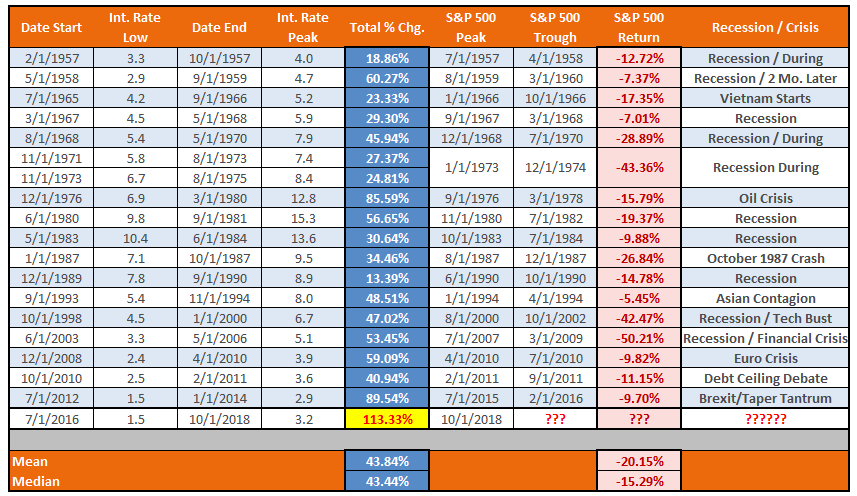
The table below looks at the rate of change from the preceding low to the subsequent peak and the outcome of rising rates. Again, there has NEVER been a period where both rates and stocks rose simultaneously. Also, as shown above, the current percentage change in rates is the highest since 1957.
More importantly, rising rates are NOT JUST a consideration of stocks versus bonds.
If the stock market falls, the top-20% of the economy gets a little depressed because their wealth declines a bit.
However, given the bottom 80% have very little invested in the financial markets, when RATES surge higher, it is 100% of the economy that feels the pinch. As Doug notes, interest rates run through the entirety of the financial and economic backdrop.
- The private and public sector have inflated debt loads today. Rising interest rates raise the cost of servicing that debt and reduce spending and productive investment.
- Private-sector activity is importantly influenced by interest rates:
- Rising mortgage rates and higher mortgage payments reduce home affordability and hurt home turnover and refinancings.
- Slowing home sales and reduced refinancings hurt spending on renovations and remodeling.
- Consumer, mortgage and corporate loans that are variable rate are hurt by climbing interest rates.
- The credit markets fall when interest rates rise, serving to have a negative wealth effect on consumers and corporations that own bonds.
- Debt is often issued by corporations in order to buy back stock and pay dividends. Advancing rates reduce a company’s return on investment on those buybacks.
- Corporate capital spending is partially dependent on borrowings. Higher borrowing costs could lead to lower capital spending.
- Public-sector activity and profitability are also importantly influenced by interest rates:
- The deficit/GDP ratio will increase as interest rates rise and the consensus expectation for lower future deficits will crumble.
- Dividend discount models are based on future estimates of cash flow discounted back at an appropriate interest rate:
- Rising interest rates reduce the value of those future cash flows and, in turn, the value or worth of a company’s stock.
- There is now an alternative to stocks as the yield on the one-month bill (2.16%) and the two-year Treasury note (2.89%) compare favorably to the S&P 500’s dividend yield of only 1.77%. Further rises in interest rates will serve as an even more competitive and attractive alternative to stocks.
- Rising interest rates in the U.S. will buoy the dollar, exacerbating the ability of weaker countries and corporations to service their dollar-denominated debt.
The issue of rising interest rates may have finally woken overly complacent investors from their bullish slumber.
We won’t know until we get a rally that fails to set a new high.
But one thing is for sure…if something hasn’t already broken, it will break soon if rates keep rising.
That day may be much sooner than most expect.
As noted above, we have tightened up stops considerably and next week will begin to start rebalancing and hedging risks accordingly.
See you next week.
Market & Sector Analysis
Data Analysis Of The Market & Sectors For Traders
S&P 500 Tear Sheet
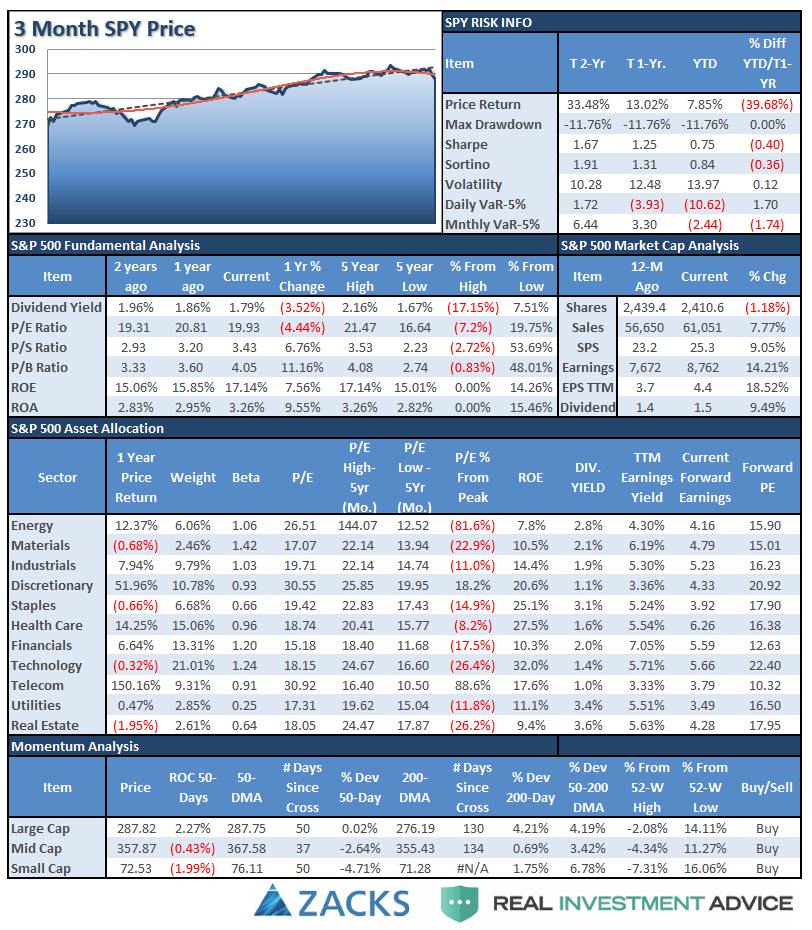
Performance Analysis
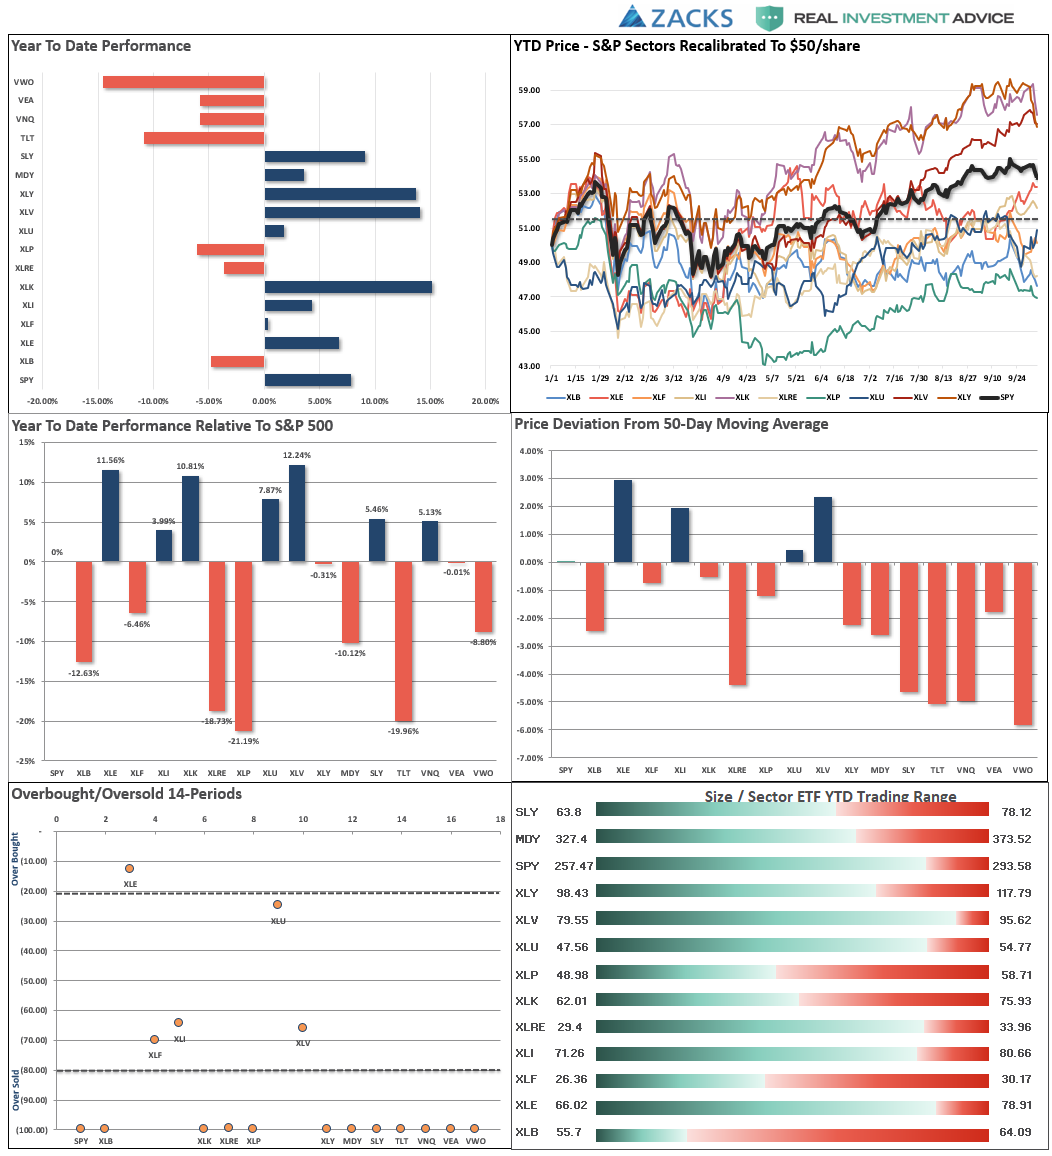
ETF Model Relative Performance Analysis

Sector & Market Analysis:
As I noted, the S&P 500 sectors have been shuffled up a bit. As such, I have changed the two charts below. The S&P analysis now includes both XLC and XLRE. I have also added the S&P 500 index just for comparative purposes.
Since real estate was moved up from the major markets graph, I have added a pure S&P 500 index for comparative performance to the equal weight and dividend weighted indices.
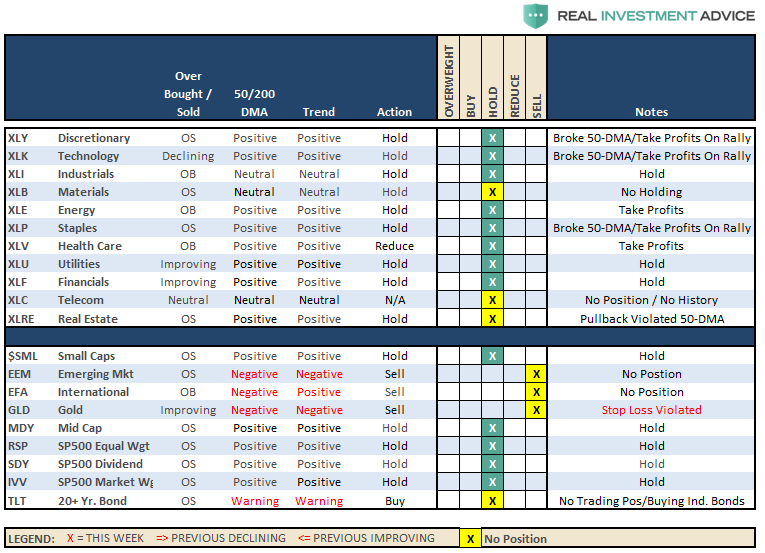
Sector-by-Sector
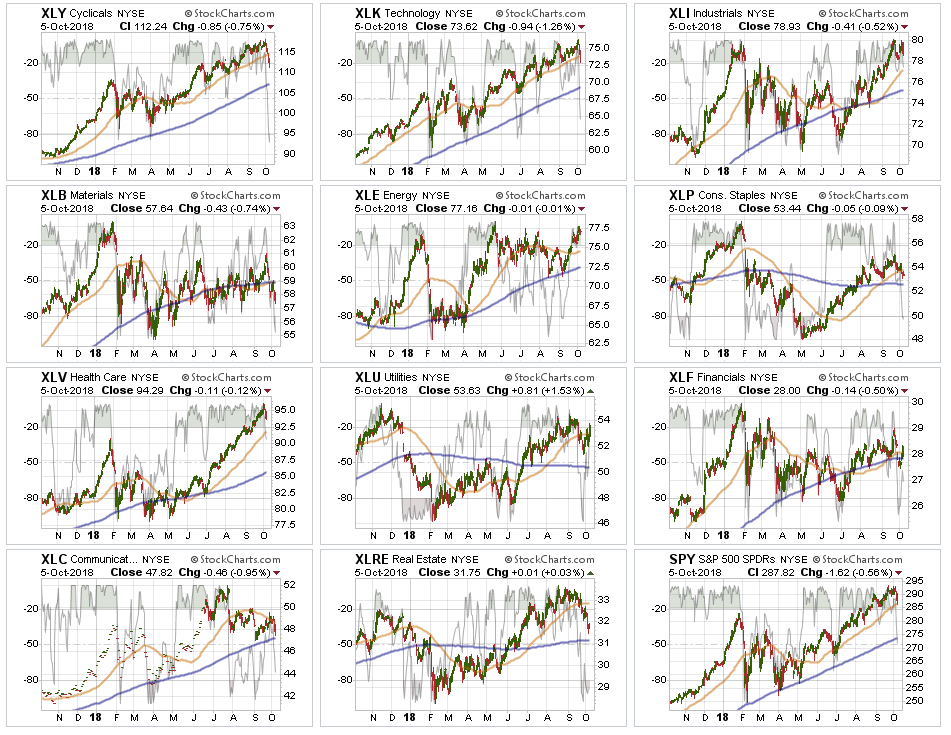

Industrials, Energy, Utilities, and Financials we the stronger performers last week as money rotated out of more consumer-oriented sectors which will likely be impacted by higher interest rates. While the sectors remain short-term bullish, money is rotating very rapidly through the market currently so some caution is advised.
Discretionary, Staples, and Materials violated their 50-dma last week. Materials remain in a bearish trend currently. With discretionary and staples getting oversold, look for a bounce next week to rebalance risks into.
Real Estate because of the rise of interest rates has been under pressure as of late. Look for support at the 200-dma. If rates fall back below 3% in the next week or two, there should be a very tradeable opportunity for REIT’s in the short-term given the very oversold condition. The recent recommendation to take profits was timely.
Energy – The uptick in oil prices over the last couple of weeks brought money flows back into the Energy sector which has rallied and is currently flirting with a “double top.” Stops should remain at the 200-dma.
Financials continue to languish. The only good news here currently is that after falling apart previously, the past weeks the sector rallied but failed at the 50-dma. Move stops up to the recent lows, and watch the 200-dma as important support.
Telecommunications – with the new reshuffle in this sector could well see a pick up in volatility. There is no reason to add this sector to holdings right now as there simply isn’t enough data yet to determine much of anything from a trading perspective. We will watch this over the next couple of months to see how things develop.

Small-Cap and Mid Cap – we noted five weeks ago that these markets were extremely overbought and extended, and a pullback to support was needed. The advice to take profits in these sectors was prescient with both sectors violating their respective 50-dma’s in the recent sell-off. Mid and Small-caps are now very oversold so look for a failed rally back to the 50-dma’s to reduce risk in portfolios.
Emerging and International Markets as I noted last week.
“Both sectors rallied a bit last week, providing an opportunity to reduce exposure for the time being and reallocate that capital to better performing areas. WHEN international and emerging markets begin to perform more positively we will add positions back to portfolios. There is just no reason to do so now.”
That advice remains the same this week. With 0 and 1 trend and momentum indicators in place, there is no reason to be long these sectors just yet. If we start to see real improvement, versus a bounce in a downtrend, we will reconsider our weightings.
Dividends, Market, and Equal Weight – we added a pure S&P 500 index fund to our “core” holdings which will add some beta to the portfolio but acts as a placeholder for sectors and markets we have no allocation to (ie, international markets, gold, basic materials.) We continue to hold our allocations to these “core holdings” and continue to build around these core with tactical positions that provided opportunistic advantages.
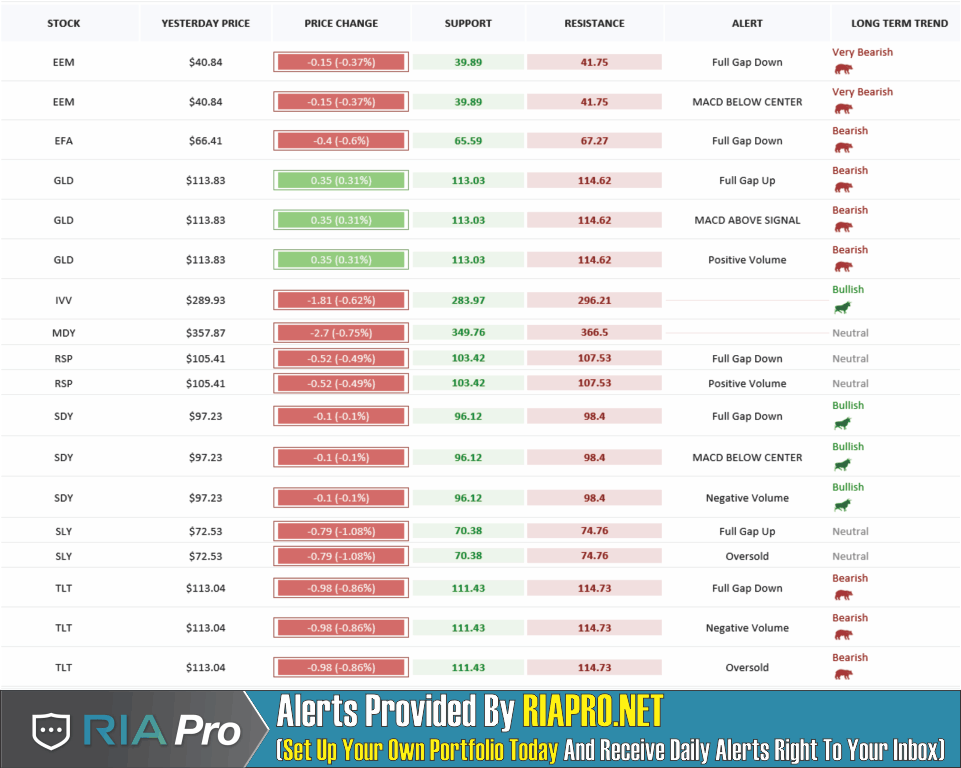
Gold – failed, again, at the 50-dma this past week. This was your opportunity to sell your holdings for the time being. Stops remain firm at $111 again this week which looks like they may well be triggered next week. Gold currently has 0 of 10 trend and momentum indicators in place.
Bonds – broke their near-term support at $114 triggering the stop loss on trading positions. However, we are now aggressively buying individual bonds at depressed prices and increasing yield in portfolios. All trading positions are currently closed.
The table below shows thoughts on specific actions related to the current market environment.
(These are not recommendations or solicitations to take any action. This is for informational purposes only related to market extremes and contrarian positioning within portfolios. Use at your own risk and peril.)
Portfolio/Client Update:
As noted, several weeks ago, with the market holding support above the “breakout” levels from January, we added exposure to portfolios. With the pullback to that breakout level this past week we will wait to see if these levels hold.
The bad news is that the rotation between sectors and markets has deteriorated in recent days, so we are becoming a bit more cautious in the short-term. However, our view that we will likely see and end-of-year push still remains intact. For now.
Currently, with portfolios fully allocated there is little to do this next week. However, we will be monitoring things closely.
- New clients: We are watching the current pullback to hold support to on-board new positions.
- Equity Model: Semiconductors (MU & KLAC) remain on “Sell Alerts” – we are monitoring these positions closely and stop-loss levels have been tightened up. If the market sells off more this coming week we will likely get stopped out of several positions which will raise our cash levels and hedge portfolio risk.
- Equity/ETF blended – Same as with the equity model.
- ETF Model: We overweighted the core “domestic” indices by adding a pure S&P 500 index ETF to offset lack of international exposure. We remain overweight outperforming sectors to offset underweights in under-performing sectors. We will likely reduce small and mid-cap holdings on a rally to the 50-dma.
- Option-Wrapped Equity Model – If the market rallies, and fails to obtain a new high, we will add a long-date S&P 5oo put option to portfolios to hedge risk.
There were no changes last week as the bulk of our positions are currently working as expected. However, as we have repeatedly stated, we are well aware of the present risk. As noted, stop loss levels have been moved up to recent lows and we continue to monitor developments on a daily basis. With the trend of the market positive, we want to continue to participate to book in performance now for a “rainy day” later.
It is important to understand that when we add to our equity allocations, ALL purchases are initially “trades” that can, and will, be closed out quickly if they fail to work as anticipated. This is why we “step” into positions initially. Once a “trade” begins to work as anticipated, it is then brought to the appropriate portfolio weight and becomes a long-term investment. We will unwind these actions either by reducing, selling, or hedging, if the market environment changes for the worse.
THE REAL 401k PLAN MANAGER
The Real 401k Plan Manager – A Conservative Strategy For Long-Term Investors
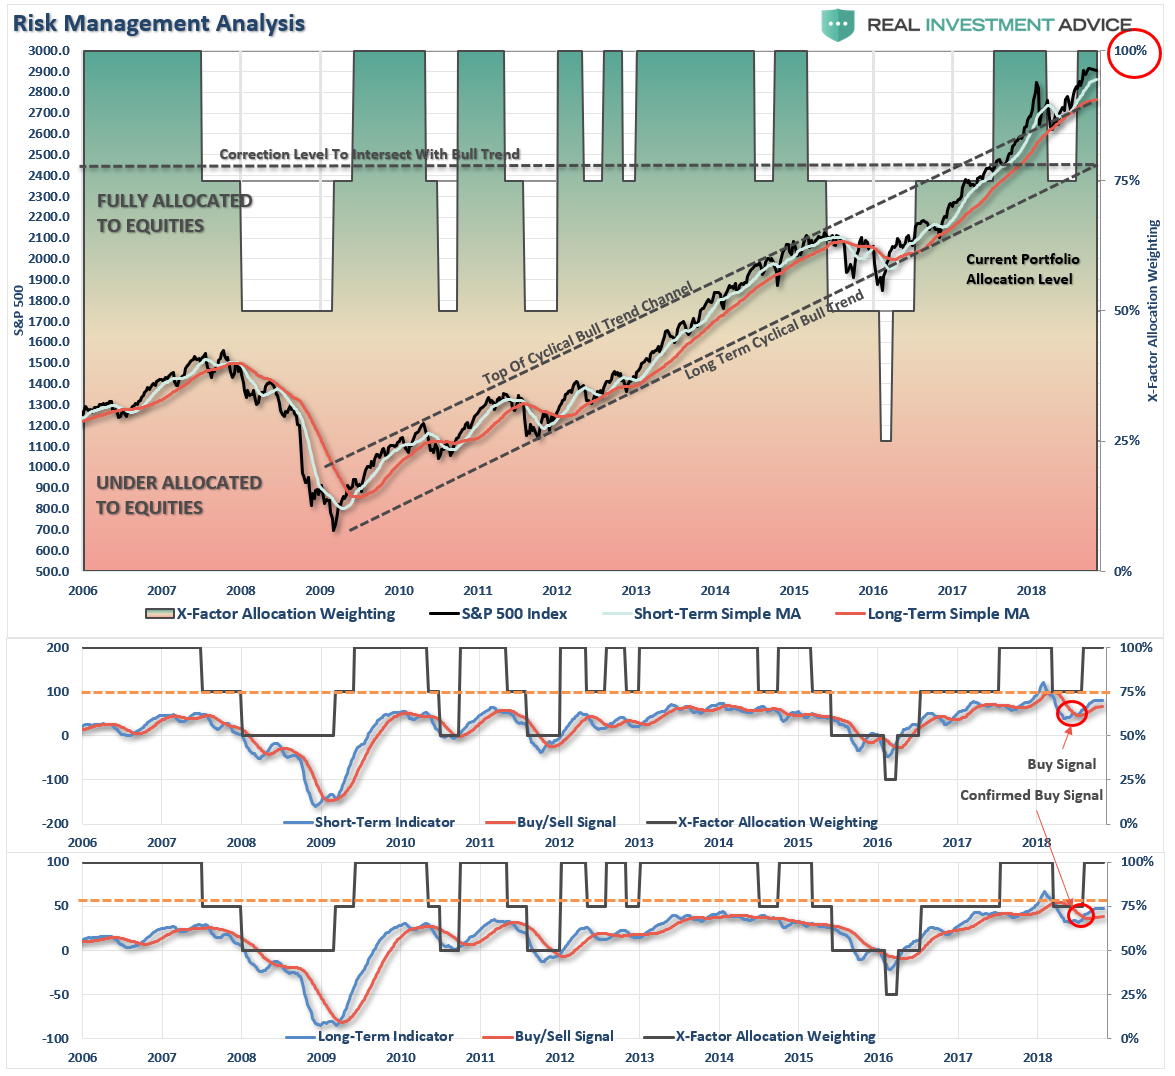
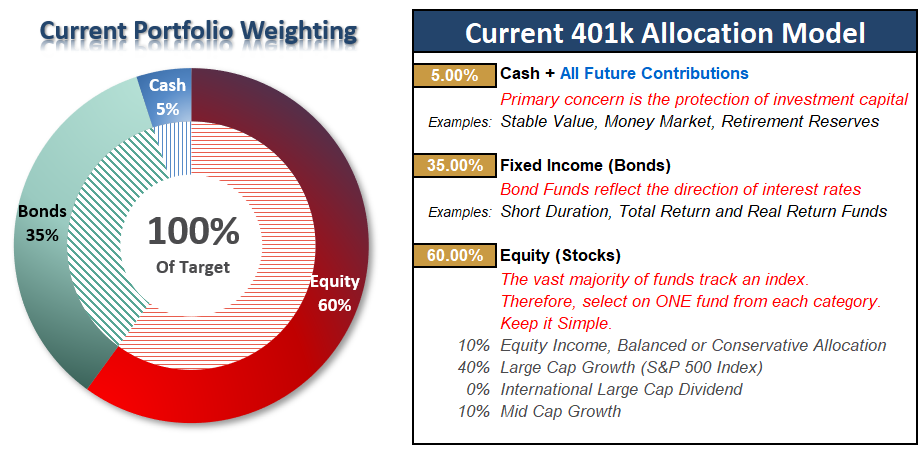
There are 4-steps to allocation changes based on 25% reduction increments. As noted in the chart above a 100% allocation level is equal to 60% stocks. I never advocate being 100% out of the market as it is far too difficult to reverse course when the market changes from a negative to a positive trend. Emotions keep us from taking the correct action.

Market Pulls Back
As I noted two weeks ago:
“With the move in portfolios back to full target allocations, there is not much for us to do right now except to remain on the lookout for the risks which could rapidly take away our performance…but I do want to note that the market is extremely extended above its longer-term trend lines and moving averages. Historically, short-term corrective processes like we saw in February are NOT uncommon.”
Well, we got a correction working off some of that over-extension and overbought condition. However, with rates above 3%, there could be more angst as we move into next week. Also, given the deterioration in the breadth of performance, risk has risen in the short-term.
However, with that being said, NOTHING has happened currently that would warrant reducing equity risk currently. Use ANY rally next week to make sure your 401k plans are balanced. Use the following guidelines for now.
- If you are overweight equities – reduce international and emerging market exposure and add to domestic exposure if needed to bring portfolios in line to target weights.
- If you are underweight equities – Use this pullback to step towards your allocation target. (1/3 of total increase needed.) As noted last week, the expected pullback provides a better risk/reward opportunity to increase exposure towards domestic equity to levels where you feel comfortable. There is no need to go “all in” at one time. Step in on any weakness.
- If you are at target equity allocations currently just rebalance weights to focus on domestic holdings.
Remember, this is your “retirement money.”
This is the one account you don’t want to #$%! up. Not only do you destroy capital, you also destroy the tax deferral as well as the company match. Be more conservative with your allocations in your 401k-plan because you have less flexibility and fewer options. This is also the one account that is your “safety net” if everything else in life goes wrong.
If you need help after reading the alert; don’t hesitate to contact me.
Current 401-k Allocation Model
The 401k plan allocation plan below follows the K.I.S.S. principle. By keeping the allocation extremely simplified it allows for better control of the allocation and a closer tracking to the benchmark objective over time. (If you want to make it more complicated you can, however, statistics show that simply adding more funds does not increase performance to any great degree.)
401k Choice Matching List
The list below shows sample 401k plan funds for each major category. In reality, the majority of funds all track their indices fairly closely. Therefore, if you don’t see your exact fund listed, look for a fund that is similar in nature.
