The Dow was up 241 points today and the Bubble Heads already think it’s “back to the races again.” I’m still cautioning “not so fast!,” however. Nothing has changed technically since last week’s major technical breakdown that caused the bellwether S&P 500 to close below a very important uptrend line that started in early-2016. The “Godfather” of chart analysis Ralph Acampora feels the same way as me and said that the “damage done to the stock market is much, much worse” than anyone is talking about.
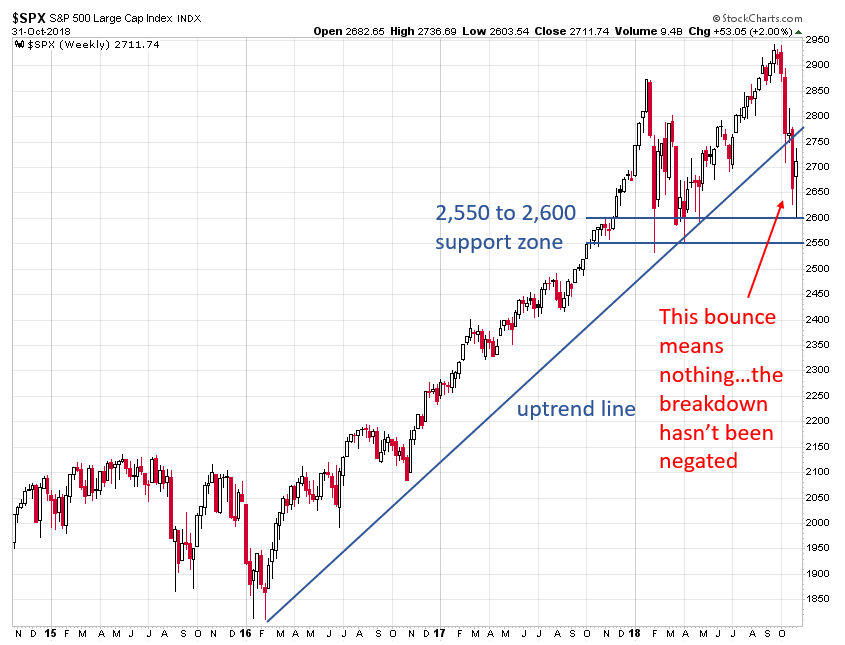
According to the chart below, the S&P 500 is still below its uptrend line, which means that the breakdown is still intact. The uptrend line is now an overhead resistance level. All of the movement that occurs between this line and the 2,550 to 2,600 support zone (the early-2018 lows) is basically randomness or “noise,” not “signal.” The S&P 500 would need to break back above its former uptrend line in a convincing manner in order to negate the breakdown. As I’ve been saying, the S&P 500 is likely to continue testing its 2,550 to 2,600 support zone before its able to stage a decent bounce. If the index closes below this zone, it would likely signal further declines ahead.
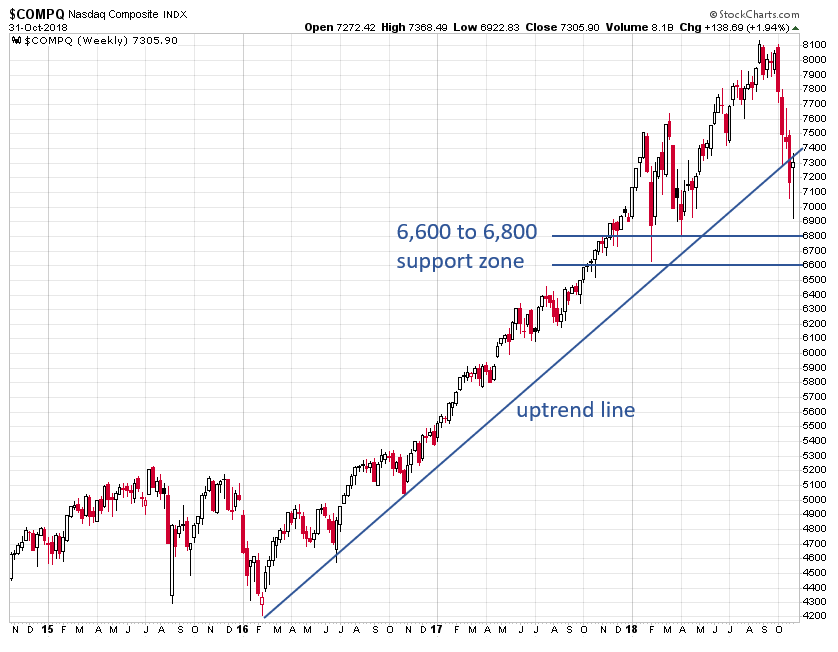
Despite the bounce of the past two days, the Nasdaq Composite index is still below its uptrend line that it broke last week, which means that the breakdown is still intact:
As I explained yesterday, I am watching if a bearish head and shoulders pattern is forming in the S&P 500 and other major U.S. stock indices. If we are actually following this pattern, the left shoulder was the late-2017 surge and early-2018 plunge, the head was the summer surge and October plunge, the S&P 500 would have further to drop in order to test its neckline, and a final “dead cat bounce” would be ahead as the right shoulder forms. 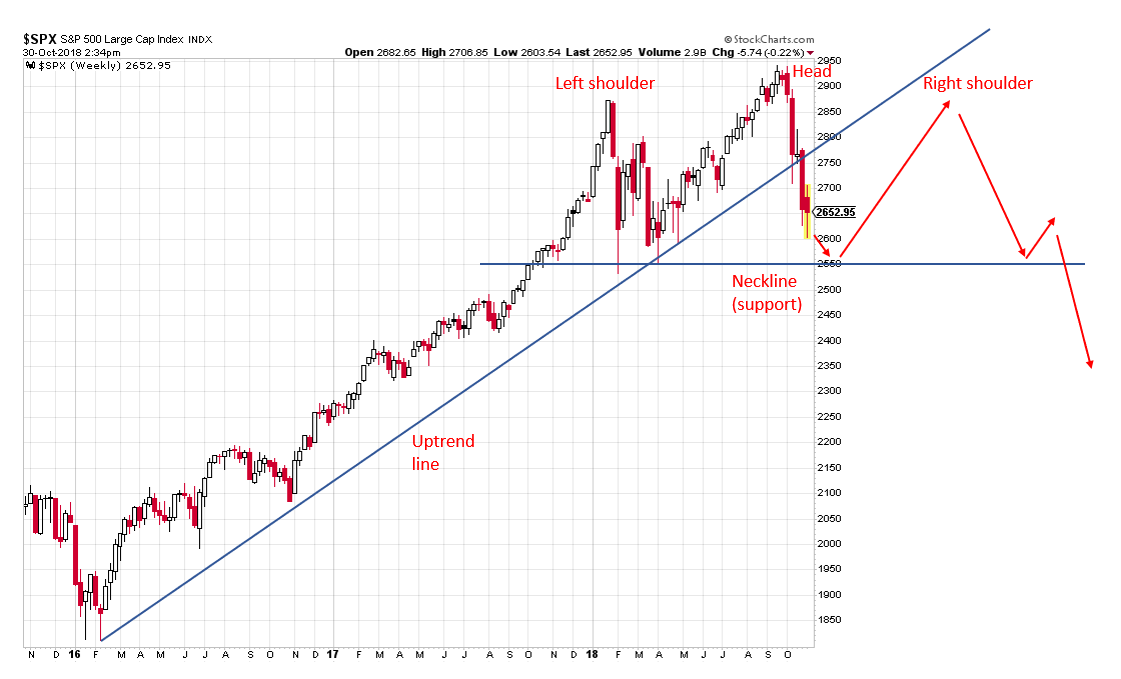
I am not predicting or guaranteeing that the market is forming a head and shoulders topping pattern. I am simply curious to see if we are forming this pattern, so I am taking a “wait and see” approach. Importantly, technical analysis is not a guarantee of future outcomes. It is the analysis of previous price trends in order to apply probabilities to our portfolio management. What this analysis clearly suggests is an environment of mounting risks in the markets which our entire portfolio management team at Real Investment Advice and Clarity Financial have been keenly focused on.
As portfolio managers, we are aware of the damage sudden and unexpected downdrafts in markets can have on invested capital. Our team produces commentary each week which discusses the near term trends of the market and how we are navigating the increasingly dangerous waters of an overvalued, late cycle, bull market. If you tired of being told to just “ride it out,” and are concerned about growing your wealth, and protecting your financial future, click here to ask me a question to find out more.