Wolf Richter wolfstreet.com, http://www.amazon.com/author/wolfrichter
Nasdaq down 8.7% in May. S&P 500 back to Jan 2018. Russell 2000 down 15.7% from peak, back to Sep 2017. FANGMAN except Microsoft get creamed.
Stocks were already gunning for the worst May since 2010 when, on the evening before the last trading day, Trump tweeted that he would impose tariffs on imports from Mexico, if Mexico doesn’t crack down on migration flows coming through its southern border. Those tariffs would hit the automakers particularly hard because they imported 2.6 million vehicles from Mexico in 2018, up 10% from the prior year. Not even counting the component makers. But the Presidential tweet was just the icing on the cake. May had been crappy for stocks before the tweet went out.
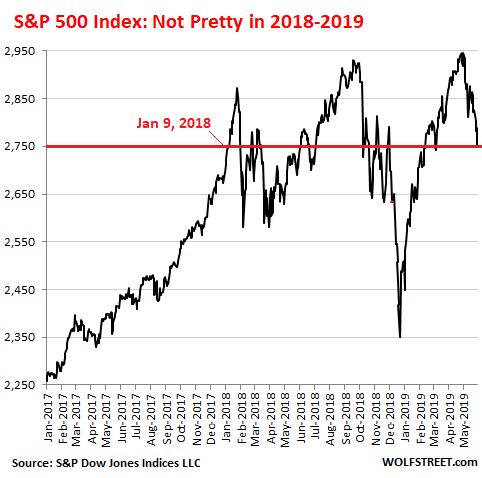
The S&P 500 index, which earlier this week had fallen through 2,800, dropped another 1.3% today to 2,752, down 6.8% from its peak in early May that had exceeded by a hair the prior peak of September 2018. The index is now back where it had first been on January 9, 2018, having spent nearly 17 months going nowhere, despite intoxicating surges and nerve-wracking drops. And the chart is morphing from “not pretty” to something a little uglier (data via S&P Dow Jones Indices):

The Dow Jones Industrial Average fell 1.1% today, unceremoniously plopping through the 25,000 level and closed at 24,815. It’s now 7.9% below its October 2018 peak and right back where it had first been in December 2017, having spent 17 months gyrating to nowhere, including a 19% peak-to-trough plunge in four months followed by a blistering 22% rally in four months.
The Nasdaq composite dropped 1.5% today, to 7,453, the level it first reached in January 2018, also going nowhere in nearly 17 months despite a huge bout of volatility. It fell 8.7% in May.
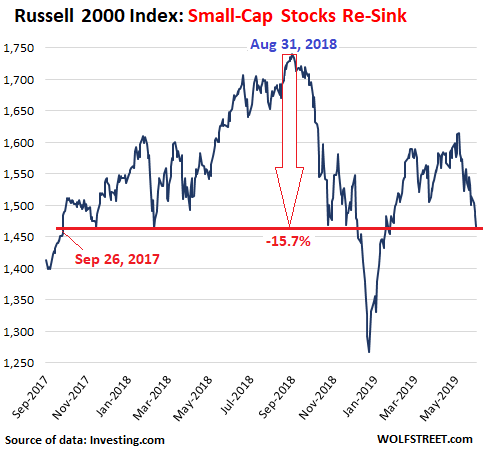
The Russell 2000 index, which covers stocks with smaller market capitalization, fell 1.3% today, to 1,478. It’s down 9.2% in May alone, down 15.7% from its October 2018 peak, and right back where it had first been on September 26, 2017, a very volatile 20 months of going nowhere. Chart looking ugly (data via Investing.com):
In terms of the Mexico debacle: GM’s shares fell 4.2% today, to $33.34. It is the automaker that is the most exposed to Mexico: GM imported 667K vehicles from Mexico in 2018, accounting for 23% of GM’s total US sales that year. In Q1 this year, GM imports from Mexico, Trump or no Trump, surged 28% year-over-year to 182K vehicles.
But don’t just blame the tweet: By Thursday evening, GM shares were already down 10% for the month of May. Friday’s dive took this loss in May to 14%.
My fancy-schmancy FANGMAN index
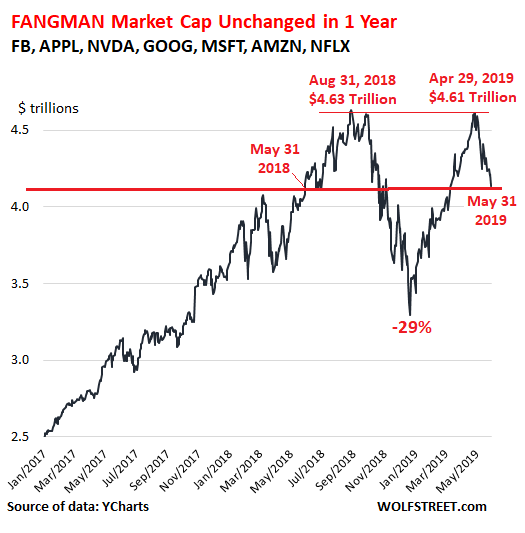
My FANGMAN index – the combined market cap of Facebook, Amazon, Netflix, Google’s parent Alphabet, Microsoft, Apple, and NVIDIA – fell 2.0% today and is down 8.7% in May.
The FANGMAN index had peaked in August 31, 2018, at $4.63 trillion, then plunged 29% to $3.29 trillion by December 24, then skyrocketed 40% to $4.61 trillion by April 29, but ominously failed to take out the August high.
Since April 29, the FANGMAN index has dropped 10.4%, giving up over one third of the blistering post-Christmas rally in just one month. The index is now back where it had first been on May 31, 2018, having gone exactly nowhere in one year despite these brain-twisting surges and plunges (market cap data via YCharts):
Here is how the FANGMAN components did:
Facebook [FB] dropped 3.0% today, and 8% in May, to $177.47. It’s down 18.8% from its all-time high in July 2018 and down 8.5% from May 31, 2018. Its market cap is now down to $507 billion.
Apple [AAPL] dropped 1.8% today and a juicy 16.8% in May, to $175.07, down 25% from its all-time high in August 2018 and down 8.0% from May 31 last year. Once the most valuable company in the S&P 500, Apple’s market cap is now down to $805 billion, behind Microsoft and Amazon.
It’s not helpful that unit sales of its flagship product line, the iPhone, have been dropping, and that it is now trying to sell more services instead, as iPhone sales are getting battered by cheaper competitors in a stagnating market.
NVIDIA [NVDA] dropped 2.6% today. It’s down 53.7% from its all-time high last October, and it’s not far from taking out its pre-Christmas low ($127.08). If it does succeed in doing this, it would be back where it had first been in May 2017. It’s down 47% from a year ago. Market cap down to $83 billion.
Alphabet [GOOG] dropped 1.3% today to $1,103.63. It had established a new high on April 29, and has plunged 14.2% since. Down 1.4% from a year ago. Market cap at $767 billion.
Microsoft [MSFT] dropped 1.6% today to $123.68. It established a new high on April 30 and has since dropped 5.3%. Up 22.7% from a year ago. Market cap of $948 billion, the most valuable company in the S&P 500.
Amazon [AMZN] dropped 2.3% today to $1,775.07. It’s down 7.9% in May, and down 13% from its all-time high on September 4. But it’s up 8.1% from a year ago. Market cap of $874 billion, behind Microsoft.
Netflix [NFLX] dropped 2.4% today to $343.28 and is down 16.5% from its all-time high last June. And it’s down 4.6% from a year ago. Market cap at $150 billion.
So thankfully that Microsoft is included in my FANGMAN index. Without the “M,” the “FANGAN” index did a lot worse: down 15.5% from its peak on August 31, down 12% from its turnaround point on April 29, and back where it first had been on January 25, 2018. A volatile, but overall orderly unwind.