Wolf Richter wolfstreet.com, http://www.amazon.com/author/wolfrichter
Existing home sales across the US drop 7% from a year ago, plunge 15.4% in the West.
Sales of existing homes — including single-family houses, townhouses, condos, and co-ops — in November, dropped 7.0% from November last year, to a seasonally adjusted annual rate (SAAR) of 5.32 million homes, according to the National Association of Realtors this morning. This was the ninth month in a row of year-over-year sales declines, and the biggest such drop since February 2014 (year-over-year comparisons eliminate the effects of seasonal fluctuations; data via YCharts):
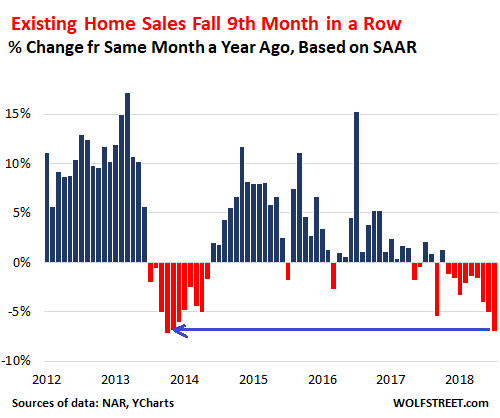
Sales of single-family houses fell 6.7% from November last year, according to the NAR report, and sales of condos and co-ops plunged 9.0%. Sales by Region — note the plunge in the West:
- Northeast: -2.6%, to an annual rate of 740,000.
- Midwest:-4.3%, to an annual rate of 1.34 million.
- South:-5.6%, to an annual rate of 2.20 million.
- West: -15.4%, to an annual rate of 1.04 million.
Total housing inventory at the end of November rose 4.2% from November last year, to 1.74 million homes.
Suddenly inventory is “plentiful,” as the NAR report puts it, after years of blaming a shortage of inventory for the rampant price increases. But it’s the wrong kind of inventory, after years of precisely these rampant price increases, and everything is too darn expensive – or as the NAR put it in more appropriate economic terms: a “mismatch between supply and demand exists at affordable price points.”
Given the dropping home sales, the number of months it takes to sell this inventory (months’ supply) jumped 11.4% year-over-year to 3.9 months. This measure of supply has been increasing for six months. The chart below shows the percent change in months’ supply compared to the same month a year earlier:
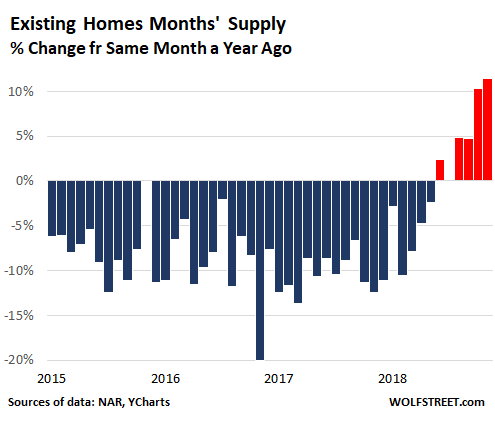
“Rising inventory is clearly taming home price appreciation,” said the NAR report.
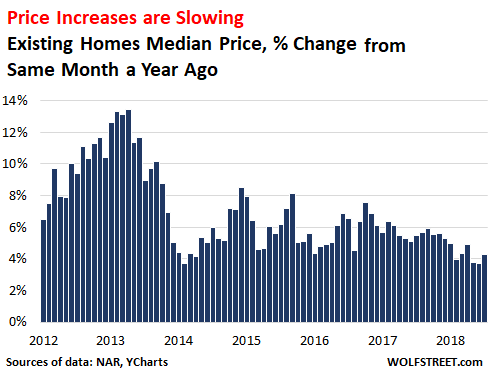
The median sales price – meaning that half of the homes sold for more and half sold for less — across the US rose 4.2% from November last year, to $257,700. Changes in the median price, year-over-year by home type:
- Single-family houses: +5.0%
- Condo and co-ops -1.3%.
Overall, the rate of year-over-year price increases over the past six months, ranging between 3.8% and 4.9%, is down sharply from the price increases over the past few years. And looking at the trend, it seems the hot air is gradually coming out of the national average:
However, housing is local. As already depicted in the regional sales volume data above, at one end of the spectrum, home sales in the West plunged 15.4% year-over-year; at the other end of the spectrum, home sales in the Northeast dropped “only” 2.6%.
“A marked shift is occurring in the West region, with much lower sales and very soft price growth,” the NAR report said. “It is also the West region where consumers have expressed the weakest sentiment about home buying, largely due to lack of affordable housing inventory.”
Yup, after years of ludicrous price increases, leading to ludicrous prices, suddenly and surprisingly for the industry, everything is too darn expensive, and potential buyers are losing their appetite for stretching beyond what the can reach.
Median home prices by region:
- Northeast, rose 6.5% from November 2017, to $291,400.
- Midwest, rose 2.6% from November 2017, to $199,100.
- South: rose 3.2% from November 2017, to $223,600.
- West: inched up 1.8% from November 2017, to $380,600.
But the West is a huge very diverse region with enormous differences in local housing markets. In the western-most strip of this region, the West Coast, two of the three biggest housing markets are already seriously and rapidly deteriorating – the Seattle metro area and the Bay Area, including San Francisco and Silicon Valley. And the process is starting in Southern California.
There are still many housing markets in the US where prices are surging. The national and regional averages that the NAR reported today are comprised of markets that are variously booming, stable, or deteriorating, each at its own pace. As the deterioration has spread more deeply to more markets, the national averages are now beginning to reflect it.