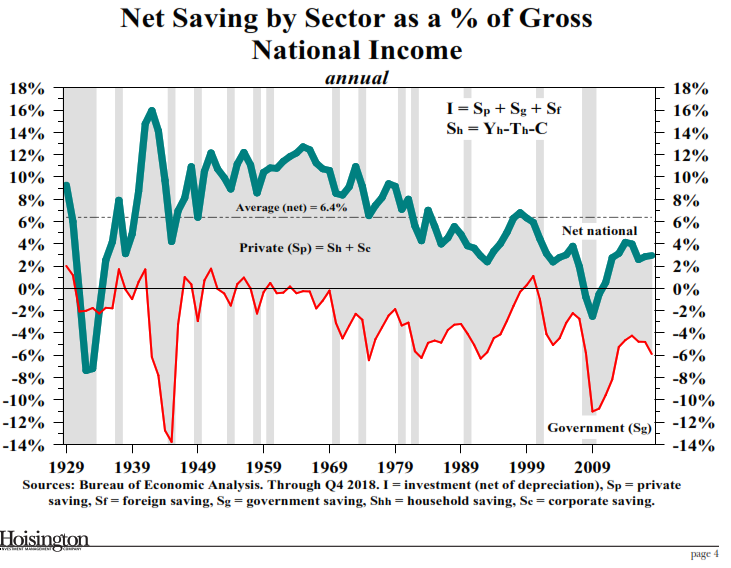
Lacy said he has never shown the next chart before. Adding, there are certain things in economics that “hold true.” This is one of the most important charts in economics:
- The green line shows the national savings rate. It is currently at 3%. It is historically 6%. We are running half of normal. The shaded area shows the private sector, which is running at 9%. That’s pretty good. The red line shows the government sector and it is running at -6% and dragging down national savings. That is where the problem lies.
- But it is not going to stay there – the government deficit is moving even lower into negative territory.
- The government deficit will continue to grow. Tax cuts and the bipartisan agreed-upon increase in spending do not lead to deficit reduction.
- Bottom line: What it says is there is an insufficiency of savings to absorb ever-larger budget deficits. National savings is not staying at 3%, it is going to decline. Real investment is going to decline. It is possible the private sector will save more but that means there will be less consumption.
- In other words, the public sector is going to constrain the private sector and the economy. (SB: Debt acts as a noose around the economy’s neck.)… and guess which sector provides the basis for better growth, the private sector or the public sector?
- In other words, the government sector’s budget deficits are too large for the level of savings
MORE: