Wolf Richter wolfstreet.com, http://www.amazon.com/author/wolfrichter
Since the Financial Crisis, the number of renters surged at a blistering pace, and renters became a majority in 42 cities, but the trend has now reversed.
The number of people living in rented housing in the US has surged by 23 million over the past 10 years. This is the period of the includes the Housing Bust. But the number of people living in owner-occupied homes (“homeowners”) inched up only by 679,000.
Over the same period, the total US population has increased by 23.7 million. In other words, the growth in the renter population absorbed nearly the entire growth in the population.
In 2006, of the 100 largest cities, only 20 had a higher renter population than owner population. Ten years later, 42 cities do.
Of the top 100 cities, only three experienced a decrease in rentership rate: Anchorage, AK (-1.3%), Irving, TX (-2.5%) and Winston-Salem, NC (-3.6%). The other 97 cities all experienced an increase in rentership rates, according to a report by RentCafé, based on data from the Census Bureau’s American Community Survey.
The list below shows the 25 cities where the rentership rate has increased the fastest from 2006 to 2016. Gilbert, AZ, is number one. Its rentership rate grew by 53.4%. But Gilbert is special. While the absolute number of renters in Gilbert surged over the decade, the city’s overall population experienced a spectacular boom, and the number of homeowners surged too, and the rentership rate, at 30.6%, remains the second lowest of the top 100 cities, though it grew the fastest.
By contrast, Toledo is number five on this list. In 2006, its rentership rate was 38.3%. Over the past 10 years, the rate grew by 31.3% to reach 50.3%. But Toledo’s overall population declined over the period, which helped boost the rentership rate.
The cities in the list are in order of how fast their rentership rates grew (right column). Even for number 25, Baton Rouge, the rentership rate still grew by over 22%!
| City and State | Renter Population 2016 | Owner Population 2016 | Renter Share 2016 | Renter Share Growth from 2006 to 2016 | |
| 1 | Gilbert, AZ | 72,346 | 164,311 | 30.6% | 53.4% |
| 2 | Plano, TX | 96,503 | 188,625 | 33.8% | 40.0% |
| 3 | St. Petersburg, FL | 101,539 | 153,457 | 39.8% | 39.4% |
| 4 | North Las Vegas, NV | 109,445 | 127,218 | 46.2% | 38.5% |
| 5 | Toledo, OH | 136,452 | 134,621 | 50.3% | 31.3% |
| 6 | Fremont, CA | 97,391 | 134,143 | 42.1% | 31.0% |
| 7 | Virginia Beach, VA | 165,246 | 276,598 | 37.4% | 30.9% |
| 8 | Mesa, AZ | 197,885 | 282,946 | 41.2% | 30.1% |
| 9 | Glendale, AZ | 108,691 | 133,269 | 44.9% | 30.0% |
| 10 | Colorado Springs, CO | 184,836 | 272,696 | 40.4% | 29.2% |
| 11 | Chesapeake, VA | 64,156 | 168,265 | 27.6% | 28.6% |
| 12 | St. Paul, MN | 140,288 | 153,368 | 47.8% | 27.6% |
| 13 | Memphis, TN | 360,449 | 275,938 | 56.6% | 27.0% |
| 14 | Charlotte, NC | 380,889 | 448,459 | 45.9% | 26.9% |
| 15 | Tampa, FL | 184,029 | 181,627 | 50.3% | 26.8% |
| 16 | Hialeah, FL | 128,135 | 106,234 | 54.7% | 26.5% |
| 17 | Jacksonville, FL | 366,649 | 492,838 | 42.7% | 26.4% |
| 18 | Stockton, CA | 160,957 | 139,493 | 53.6% | 26.2% |
| 19 | Honolulu, HI | 189,690 | 148,736 | 56.1% | 25.7% |
| 20 | Anaheim, CA | 200,424 | 146,001 | 57.9% | 25.1% |
| 21 | Garland, TX | 96,819 | 137,073 | 41.4% | 24.7% |
| 22 | Las Vegas, NV | 289,577 | 335,451 | 46.3% | 24.7% |
| 23 | Irvine, CA | 128,547 | 130,084 | 49.7% | 23.2% |
| 24 | Chandler, AZ | 93,596 | 153,041 | 37.9% | 22.6% |
| 25 | Baton Rouge, LA | 113,888 | 105,220 | 52.0% | 22.4% |
Why is New York City not in this list?
With 5.4 million renters, the City’s rentership rate is 65%. But given the gargantuan size of the rental market, even the massive increase over the past ten years of nearly 440,000 renters – more than the entire renting population in Boston – raised the rentership rate by only 4.5%.
RentCafé’s report also found that the overall population shrank in 12 of the top 100 cities. In eight of them – Toledo, Honolulu, Santa Ana, Baltimore, Cleveland, St. Louis, and Chicago – the ownership population took the entire hit, while the number of renters actually increased.
In Detroit, even the renter population decreased 2%, but this was “trivial compared to the 30% setback” that the homeowner population experienced over the decade, according to RentCafé.
The table below shows the top 100 cities in order of their rentership rates (second column from the right). Note that in Newark, Jersey City, Miami, New York City, and Boston, around two-thirds or more of the population lives in rental homes. In the top 42 cities, over 50% of the population lives in rental homes.
Use the search function in your browser to find a city. After you’re finished with the table, move to the section under it where we get into why this shift has happened, where it goes from here, and what it means.
| City and State | Renter Population 2016 | Owner Population 2016 | Renter Share 2016 | Renter Share Change 2006 vs. 2016 | |
| 1 | Newark, NJ | 199,659 | 68,905 | 74.3% | 3.0% |
| 2 | Jersey, NJ | 184,156 | 77,365 | 70.4% | 10.7% |
| 3 | Miami, FL | 301,082 | 141,798 | 68.0% | 9.9% |
| 4 | New York City, NY | 5,441,635 | 2,919,054 | 65.1% | 4.5% |
| 5 | Boston, MA | 397,187 | 226,302 | 63.7% | 8.7% |
| 6 | Orlando, FL | 172,592 | 102,510 | 62.7% | 6.9% |
| 7 | Long Beach, CA | 283,183 | 178,350 | 61.4% | 9.8% |
| 8 | Los Angeles, CA | 2,365,634 | 1,525,562 | 60.8% | 6.2% |
| 9 | Cincinnati, OH | 170,480 | 115,623 | 59.6% | 11.8% |
| 10 | Oakland, CA | 243,423 | 169,939 | 58.9% | 11.5% |
| 11 | Norfolk, VA | 127,876 | 90,720 | 58.5% | 12.7% |
| 12 | Washington, DC | 375,005 | 266,396 | 58.5% | 11.5% |
| 13 | Buffalo, NY | 144,967 | 102,971 | 58.5% | 9.7% |
| 14 | Richmond, VA | 123,233 | 88,602 | 58.2% | 9.1% |
| 15 | Anaheim, CA | 200,424 | 146,001 | 57.9% | 25.1% |
| 16 | Milwaukee, WI | 332,579 | 245,681 | 57.5% | 14.0% |
| 17 | Memphis, TN | 360,449 | 275,938 | 56.6% | 27.0% |
| 18 | Santa Ana, CA | 186,433 | 142,907 | 56.6% | 17.5% |
| 19 | Irving, TX | 134,111 | 102,753 | 56.6% | -2.5% |
| 20 | Atlanta, GA | 247,656 | 192,525 | 56.3% | 11.9% |
| 21 | San Francisco, CA | 478,400 | 371,683 | 56.3% | 4.2% |
| 22 | Honolulu, HI | 189,690 | 148,736 | 56.1% | 25.7% |
| 23 | Cleveland, OH | 208,887 | 164,081 | 56.0% | 16.3% |
| 24 | Columbus, OH | 462,144 | 376,953 | 55.1% | 17.5% |
| 25 | Hialeah, FL | 128,135 | 106,234 | 54.7% | 26.5% |
| 26 | Dallas, TX | 711,919 | 589,813 | 54.7% | 9.3% |
| 27 | San Bernardino, CA | 110,871 | 94,581 | 54.0% | 12.2% |
| 28 | Houston, TX | 1,221,467 | 1,050,555 | 53.8% | 6.6% |
| 29 | Stockton, CA | 160,957 | 139,493 | 53.6% | 26.2% |
| 30 | San Diego, CA | 730,393 | 637,809 | 53.4% | 11.4% |
| 31 | Baltimore, MD | 310,975 | 281,290 | 52.5% | 15.4% |
| 32 | Reno, NV | 125,778 | 114,134 | 52.4% | 9.7% |
| 33 | Fresno, CA | 268,792 | 245,102 | 52.3% | 7.6% |
| 34 | Baton Rouge, LA | 113,888 | 105,220 | 52.0% | 22.4% |
| 35 | Detroit, MI | 342,877 | 316,126 | 52.0% | 17.4% |
| 36 | St. Louis, MO | 156,218 | 144,679 | 51.9% | 14.6% |
| 37 | Chicago, IL | 1,357,704 | 1,287,263 | 51.3% | 8.5% |
| 38 | Austin, TX | 475,240 | 451,205 | 51.3% | 5.9% |
| 39 | Minneapolis, MN | 200,748 | 195,277 | 50.7% | 13.9% |
| 40 | Toledo, OH | 136,452 | 134,621 | 50.3% | 31.3% |
| 41 | Tampa, FL | 184,029 | 181,627 | 50.3% | 26.8% |
| 42 | Sacramento, CA | 244,394 | 241,919 | 50.3% | 11.0% |
| 43 | Irvine, CA | 128,547 | 130,084 | 49.7% | 23.2% |
| 44 | Durham, NC | 125,652 | 127,119 | 49.7% | 0.7% |
| 45 | New Orleans, LA | 185,353 | 189,495 | 49.4% | 5.5% |
| 46 | Pittsburgh, PA | 137,349 | 142,279 | 49.1% | 18.0% |
| 47 | Greensboro, NC | 133,548 | 139,261 | 49.0% | 11.0% |
| 48 | Tulsa, OK | 193,563 | 203,204 | 48.8% | 11.3% |
| 49 | Seattle, WA | 330,968 | 350,884 | 48.5% | 13.6% |
| 50 | Lubbock, TX | 116,221 | 124,643 | 48.3% | 15.7% |
| 51 | St. Paul, MN | 140,288 | 153,368 | 47.80% | 27.60% |
| 52 | Raleigh, NC | 209,715 | 229,051 | 47.80% | 9.40% |
| 53 | Denver, CO | 320,149 | 359,158 | 47.10% | 15.50% |
| 54 | Madison, WI | 112,987 | 127,788 | 46.90% | 10.70% |
| 55 | Tucson, AZ | 235,305 | 268,609 | 46.70% | 10.80% |
| 56 | Las Vegas, NV | 289,577 | 335,451 | 46.30% | 24.70% |
| 57 | North Las Vegas, NV | 109,445 | 127,218 | 46.20% | 38.50% |
| 58 | Phoenix, AZ | 736,340 | 860,327 | 46.10% | 20.40% |
| 59 | Charlotte, NC | 380,889 | 448,459 | 45.90% | 26.90% |
| 60 | Philadelphia, PA | 695,839 | 822,943 | 45.80% | 20.60% |
| 61 | Indianapolis, IN | 379,418 | 457,115 | 45.40% | 20.40% |
| 62 | Riverside, CA | 141,022 | 170,416 | 45.30% | 15.40% |
| 63 | Glendale, AZ | 108,691 | 133,269 | 44.90% | 30.00% |
| 64 | Winston Salem, NC | 103,637 | 128,789 | 44.60% | -3.60% |
| 65 | Nashville, TN | 284,198 | 354,942 | 44.50% | 15.70% |
| 66 | Aurora, CO | 158,225 | 201,365 | 44.00% | 19.10% |
| 67 | Portland, OR | 270,638 | 352,628 | 43.40% | 13.50% |
| 68 | Lexington, KY | 131,361 | 174,306 | 43.00% | 14.00% |
| 69 | Jacksonville, FL | 366,649 | 492,838 | 42.70% | 26.40% |
| 70 | Chula Vista, CA | 113,130 | 151,889 | 42.70% | 15.50% |
| 71 | San Antonio, TX | 625,321 | 844,505 | 42.50% | 19.70% |
| 72 | San Jose, CA | 427,798 | 582,949 | 42.30% | 16.00% |
| 73 | Fremont, CA | 97,391 | 134,143 | 42.10% | 31.00% |
| 74 | Arlington, TX | 163,587 | 224,784 | 42.10% | 8.80% |
| 75 | Bakersfield, CA | 155,552 | 216,696 | 41.80% | 9.10% |
| 76 | Corpus Christi, TX | 132,344 | 184,925 | 41.70% | 11.90% |
| 77 | Kansas, MI | 197,052 | 275,292 | 41.70% | 10.20% |
| 78 | Garland, TX | 96,819 | 137,073 | 41.40% | 24.70% |
| 79 | Mesa, AZ | 197,885 | 282,946 | 41.20% | 30.10% |
| 80 | Lincoln, NB | 108,197 | 158,962 | 40.50% | 19.10% |
| 81 | Colorado Springs, CO | 184,836 | 272,696 | 40.40% | 29.20% |
| 82 | Fort Worth, TX | 339,088 | 501,463 | 40.30% | 14.80% |
| 83 | El Paso, TX | 269,654 | 405,999 | 39.90% | 6.60% |
| 84 | St. Petersburg, FL | 101,539 | 153,457 | 39.80% | 39.40% |
| 85 | Omaha, NE | 172,805 | 262,056 | 39.70% | 8.30% |
| 86 | Louisville, KY | 236,550 | 365,218 | 39.30% | 21.00% |
| 87 | Oklahoma City, OK | 242,811 | 380,720 | 38.90% | 10.60% |
| 88 | Wichita, KS | 146,271 | 238,393 | 38.00% | 15.10% |
| 89 | Chandler, AZ | 93,596 | 153,041 | 37.90% | 22.60% |
| 90 | Virginia Beach, VA | 165,246 | 276,598 | 37.40% | 30.90% |
| 91 | Albuquerque, NM | 206,909 | 346,541 | 37.40% | 3.20% |
| 92 | Boise, ID | 81,460 | 138,621 | 37.00% | 9.50% |
| 93 | Anchorage, AK | 106,110 | 184,424 | 36.50% | -1.30% |
| 94 | Fort Wayne, IN | 92,472 | 164,267 | 36.00% | 11.90% |
| 95 | Henderson, NV | 104,200 | 186,949 | 35.80% | 16.50% |
| 96 | Laredo, TX | 88,326 | 166,596 | 34.60% | 1.90% |
| 97 | Plano, TX | 96,503 | 188,625 | 33.80% | 40.00% |
| 98 | Scottsdale, AZ | 78,379 | 166,628 | 32.00% | 16.70% |
| 99 | Gilbert, AZ | 72,346 | 164,311 | 30.60% | 53.40% |
| 100 | Chesapeake, VA | 64,156 | 168,265 | 27.60% | 28.60% |
Why is this happening?
During the housing bust, millions of people lost their homes (or seen differently, they shed a horribly under-water mortgage that the banks, the Fed, and the US Treasury then ended up with). These folks moved into rental housing. In 2008, the population in rental housing surged by 3.1%, in 2009 by 4.4%, in 2010 by 3.4%. And it continued to rise albeit at decreasing rates through 2015. In 2016, the number of renters edged down for the first time:
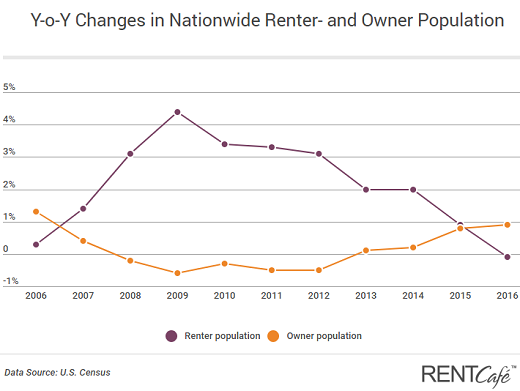
The number of homeowners did the reverse. But it is now ticking up again (+0.9% in 2016).
The surge in rentership rates after the Housing Bust has been a boon for developers and landlords, and rents have rocketed higher, which triggered a phenomenal multifamily construction boom especially in large cities where apartment towers are shooting up like mushrooms. All hot housing markets have these construction booms. But just as these towers are being delivered and the apartments are being put on the market, rentership begins to edge down. Soaring supply of apartments meets declining demand for them.
Rents in some of the formerly hottest rental markets are already showing signs of declines – and in some markets, sharp declines. One special case is Seattle, where the construction boom has been nothing but fantastic, and now vacancies are rising and rents are skidding, and they’re falling the most in the Amazon neighborhood, where new supply is piling up the fastest. Read… Once Hot Seattle Apartment Market Hit by Onslaught of Supply