
U.S. Treasury securities across the maturity spectrum are reaching yield resistance levels that have proven for decades to be extremely valuable to investors engaged in technical analysis. We believe it is possible the reaction of interest rates to these resistance levels will hold important clues about future economic activity and the direction of the stock market. While it is certainly possible that Treasury yields meander and prove these decade-old technical levels meaningless, strategic planning for what is certainly a heightened possibility of large asset moves is always wise.
Many investment pundits are scoffing at the recent move higher in Treasury yields. Since record low yields were set in mid-2016, the ten-year U.S. Treasury note has risen by about 1.50%. When compared to increases of three to five percent that occurred on numerous occasions over the last 30 years, it’s hard to blame them for barely raising an eyebrow at a mere 1.50%. What these so-called experts fail to grasp, is that the amount of financial and economic leverage has grown rapidly over the last thirty years. As such, it now takes a much smaller increase in interest rates to slow economic growth, raise credit concerns, reduce the ability to add further debt and generate financial market volatility.
The 1.50% increase in interest rates over the last two years is possibly equal to or even more significant than those larger increases of years past. In this article, we look back at how the economy and assets performed in those eras. We then summarize potential economic and market outcomes that are dependent on the resolution of current yields against their resistance levels.
Technical Analysis
In October 1981, following a period of strong inflation and dollar weakness, the yield on the ten-year U.S. Treasury note peaked at 15.84%. Since those daunting days, bond yields have gradually declined to the lowest levels in U.S. recorded history. To put the duration of this move in context, no investment professional under the age of 60 has worked in a true secular bond bear market.
During this long and durable decline in interest rates, there were periods were interest rates moved counter to the trend. In some cases, moves higher in yield were sudden and the effects on the economy and financial markets were meaningful. In our article 1987, we showed how an increase of over 3.00% on the ten-year Treasury note over a ten month period was a leading cause of Black Monday, the largest one-day loss in U.S. stock market history.
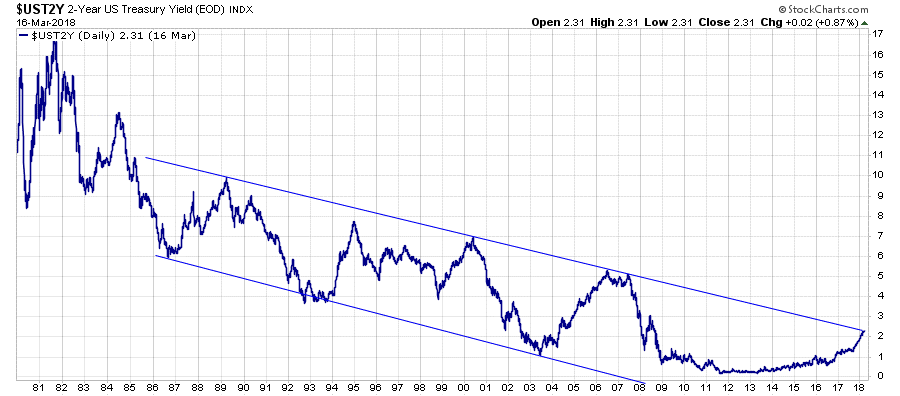
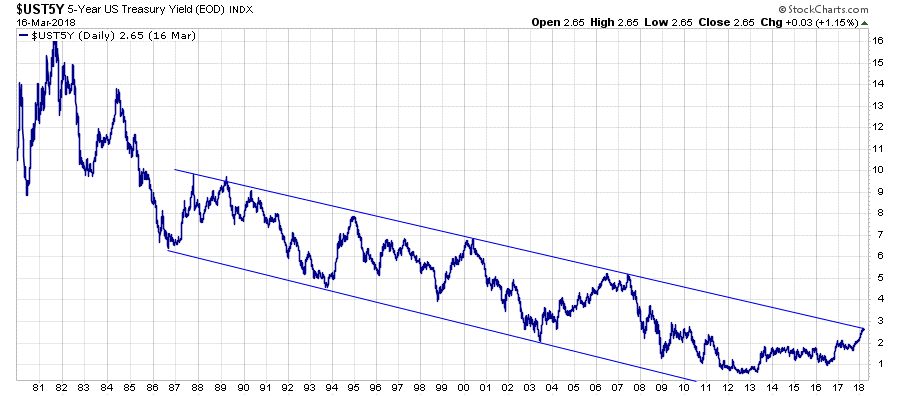
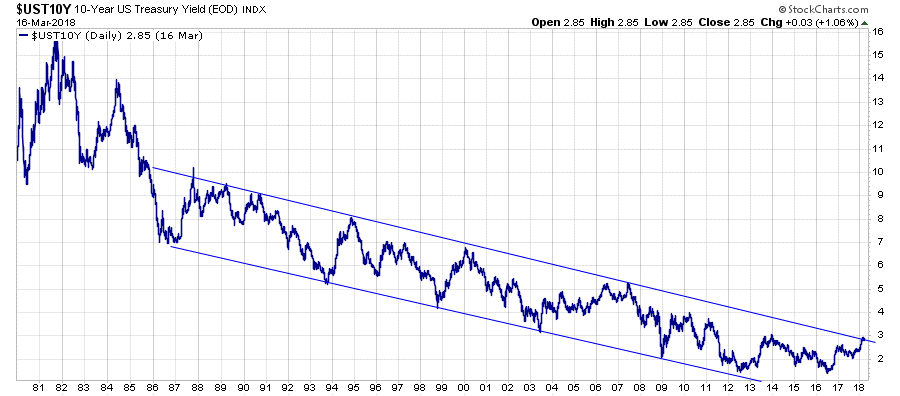
Interestingly, historical short-term peaks in yield have been technically related. When graphed, the peaks and troughs can be neatly connected with a linear downward sloping channel, which has proven reliable support and resistance for yields. The graphs below show the decline in yields and the respective channels for Two, Five and Ten-year Treasury notes. Our focus is on the resistance yield line, the upper line of the channels.
Two-Year Note
Five-Year Note
Ten-Year Note
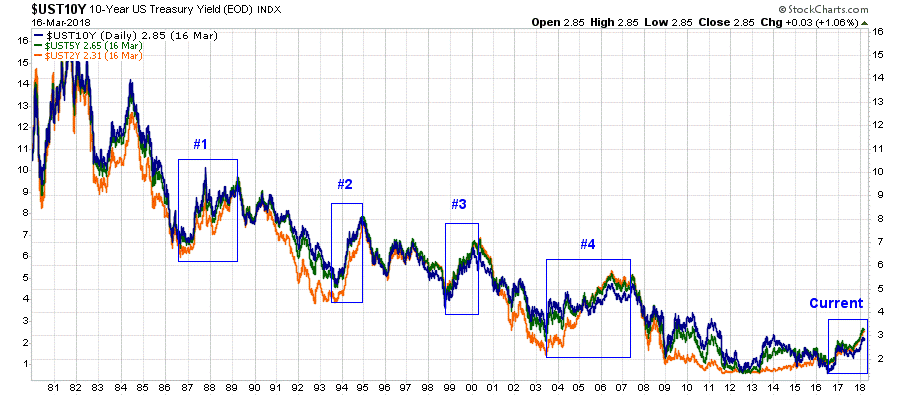
The composite graph below shows all three securities together with labeled boxes that correspond to commentary beneath the chart for each era.
All Graphs Courtesy: Stockcharts
#1 1986-1990- This period followed a significant reduction of yields as then-Fed Chairman Paul Volcker (1979-1987) successfully employed higher interest rates to tame double-digit inflation and restore faith in the U.S. Dollar. Despite inflation being “conquered” and interest rates dropping meaningfully, interest rates reversed course and began moving higher again. In the first ten months of 1987, the ten-year U.S. Treasury yield rose approximately 3.00%. Higher yields coupled with several other factors produced Black Monday, a 22% decline in the Dow Jones Industrial Average that is still the largest one-day loss on a percentage basis in U.S. equity market history. Following the 1987 stock market turmoil, yields receded. This decline was short-lived, and by early 1989, yields had exceeded the levels of 1987. Marked by the Savings & Loan Crisis, a recession followed from July 1990 to March 1991 in which GDP declined by 5.3%. From peak to trough, the S&P 500 declined 20%, and the 10-year Treasury note yield would decline by 3.75% over the next three years.
#2 1994-1995- This period is coined “the Great Bond Massacre.” In only 14 months, 2-year Treasury note yields rose over 4%. Starting in February of 1994, the Fed increased the Fed Funds rate in a move that, despite previous warnings from Greenspan, caught investors and Wall Street off guard. The Fed continued a series of rate hikes that inflicted heavy damage on insurance companies, mutual funds, hedge funds and other leveraged bondholders. In the years preceding this era, the growing use of securitized fixed income products, derivatives and leverage magnified the damage that would typically be caused by a similar change in interest rates. The tail end of this period was marked by the Mexican Peso crisis and the Orange County, California bankruptcy. Both events were directly the result of the rise in interest rates. Despite damage to bondholders and the liquidation of some large funds, the effects on the economy and stock investors were surprisingly small.
For more information on this event, we recommend reading The Great Bond Massacre, published by Fortune in 1994.
#3 1998-2001- Despite a strong U.S. economy in 1997 and 1998, various financial events such as the Russian debt default, Asian financial crisis and the implosion of the poorly named hedge fund Long Term Capital Management (LTCM) resulted in Alan Greenspan and the Fed reducing the Fed Funds rate. Unlike other instances in which the Fed provided an economic boost to the economy, this stimulus occurred with an economy that, by all measures, was running hot. Productivity was rising as technological innovation seemed endless, and government deficits were turning to surpluses. Easy money fed rampant speculation in the stock market, especially the tech sector.
In 1999, the Fed started raising rates, and the entire yield curve followed. Over this period of slightly more than a year, ten-year notes rose by about 2.75% and reached their peak in January 2000. In March of 2000, the NASDAQ reached an all-time high that would not be eclipsed for another 16.5 years. By the third quarter, higher interest rates and the popping of the tech bubble resulted in a recession that would last three quarters. From the peak in yields to June 2003, ten-year note yields declined by 3.75%. From peak to trough, the S&P 500 fell by over 50% and the NASDAQ by a staggering 83%.
#4 2004-2007- In the aftermath of the tech crash and recession of 2001, the Fed kept the fed funds rate at or below 2% for over two years. Instead of setting rates at a level appropriate for the level of economic growth, they used generous monetary policy to help reignite the financial fervor of the late ‘90’s. While the benefits of excessive stimulus helped all financial assets, the housing sector seemed to benefit most. In 2004, the Fed sensed stronger economic growth. Over the next three years, they would gradually increase the Fed Funds rate by 4.25% from 1.00% to 5.25%. From 2003 to 2007, the ten-year note yield rose 2.25%. Shortly after the peak in yields, real-estate prices crashed nationwide, and the great financial crisis ensued. From 2007 to 2009, GDP declined 5.1%, and the S&P 500 again fell over 50%. To combat the crisis, the Fed lowered the fed funds rate to zero, provided a large number of generous bailouts for financial institutions and introduced Quantitative Easing (QE).
Today
Monetary policy has remained in crisis mode ever since 2008. As a result, interest rates reached levels never seen before in U.S. history. The Fed bought over $3.5 trillion of U.S. Treasury and mortgage-backed securities via QE of which about two-thirds of the purchases occurred well after the economy was out of recession. In late 2015, the Fed began to slowly increase the fed funds rate, and the Fed appears set to take a more aggressive approach this year. They have also begun to slowly reduce their balance sheet by allowing securities purchased during QE to mature without being replaced. As a result of the tighter monetary policy, yields have begun to rise. Thus far, financial conditions remain stimulative, and the increase in yields has not been nominally comparable to the previous periods detailed above. As discussed at the beginning of the article, it is not just the level of rates but the amount of debt outstanding that matters. This was the lesson learned by many in 1994 and it holds even truer today.
Currently, all three Treasury note yields are perched up against their technical resistance lines. From this, we can conclude there are three likely scenarios.
- Resistance holds and yields decline sharply as they have done in the past
- Yields break above the trend line, marking the end to the 35-year-old bond bull market
- Yields meander with no regard for the dependable technical guideposts that have worked so well in the past.
Bond Investors and holders of other financial assets should pay close attention to this dynamic and be prepared. The following summarizes expectations for the three scenarios listed above.
- Resistance holds and yields decline sharply– If yields decline sharply as they have previously, it will likely be due to slowing economic activity and/or a flight to quality. A flight to quality, in which investors seek the safety of U.S. Treasuries, is typically the result of financial market volatility and/or a geopolitical situation. Given extreme equity valuations, investors should be prepared for significant stock price declines, as was witnessed three of the past four times the resistance level was reached and held.
- Yields break through the trend line – If resistance does not contain yields, it is quite likely that technical traders will take the cue and accelerate bond selling and shorting, leading to the possibility of a sharper increase in yields. This condition could be further aggravated by poor supply and demand dynamics for Treasury securities as noted in Deficits Do Matter. Given the amount of economic and financial leverage outstanding as well as the economy’s dependence on low interest rates, we expect growth will suffer mightily if yields rise aggressively. In turn, this will dampen corporate earnings and ultimately weigh on stock prices.
- Yields meander– This is the Goldilocks scenario for the economy and the financial markets. This scenario rests on a healthy equilibrium in the economy where growth is moderate, and inflation remains tame. Given that current interest rates are not high enough to significantly harm economic growth or hinder government borrowing, we suspect that the massive fiscal stimulus along with decent global growth will keep GDP propped up. We also suspect that, despite high valuations, stocks would likely be stable to higher.
Summary
Of the three possible scenarios, rates meandering holds the lowest probability.
The historical interest rate events discussed above offer hints that allow investors to better assess the possibility of each scenario but, unfortunately, with unusually poor clarity. The reason is our starting point on this occasion is without historical precedence. We are at the lowest levels of interest rates in the history of mankind and the highest amount of leverage. To make matters worse, central banks don’t understand the effects of their recent interventions.
The economy has just received a large fiscal boost via the tax cut and new budget agreement which will be accompanied by large deficits for years to come. The growth impulse over the next several quarters will be meaningful, but there are a variety of offsets. First, the Fed is hiking rates and removing unconventional stimulus (QE). Second, tariffs intended to level the trade paying field hold an uncertain outcome but run the risk of stoking both inflation and the ire of foreign trading partners. Geopolitical risks remain elevated, and those come with the small but real threat of an exogenous shock to the economy. Synchronous global growth appears to be forming, but recent data from China and Europe imply economic deceleration. Uncertainties remain quite high and are not being accounted for in the price of risky assets.
The one sure thing we would bet on for the remainder of 2018 is more volatility in every asset class, including interest rates. As a direct input into the pricing of all financial securities, higher volatility tends to imply lower stock prices and wider credit spreads on high-yield debt. As such, bond and stock investors should equip themselves to deal with volatile markets. The reprieve of the moment is a gift and should humbly be viewed as such.
Michael Lebowitz, CFA

Investment Analyst and Portfolio Manager for Clarity Financial, LLC. specializing in macroeconomic research, valuations, asset allocation, and risk management. RIA Contributing Editor and Research Director. Co-founder of 720 Global Research.
Follow Michael on Twitter or go to 720global.com for more research and analysis.