Wolf Richter wolfstreet.com, http://www.amazon.com/author/wolfrichter
These are getting to be serious amounts.
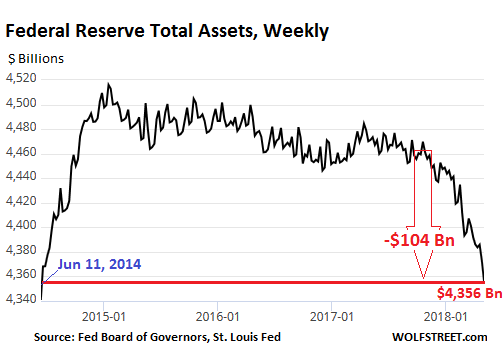
The QE Unwind is ramping up toward cruising speed. The Fed’s balance sheetfor the week ending May 2, released this afternoon, shows a total drop of $104 billion since the beginning of the QE Unwind in October – to the lowest level since June 11, 2014.
During the years and iterations of QE, the Fed acquired $3.4 trillion in Treasury securities and mortgage-backed securities. The mortgages underlying those MBS are guaranteed by Fannie Mae, Freddie Mac, and Ginnie Mae. The “balance sheet normalization,” as the Fed calls it, was nudged into motion last October. But the pace accelerates every quarter until it reaches up to $50 billion a month in Q4 this year.
This would trim the balance sheet by up to $420 billion this year, and by up to $600 billion in 2019 and every year going forward, until the Fed considers the balance sheet to be adequately “normalized” — or until something big breaks, whichever comes first.
In April, the scheduled maximum pace was $30 billion (up from $20 billion in January, February, and March): $20 billion in Treasuries and $10 billion in MBS.
Treasury securities
The balance of Treasury securities fell by $17.6 billion in April. This is up 60% from March, when $11 billion “rolled off.” Since the beginning of the QE-Unwind, $70 billion in Treasuries “rolled off.” Now at $2,395 billion, the balance of Treasuries has hit the lowest level since June 18, 2014.
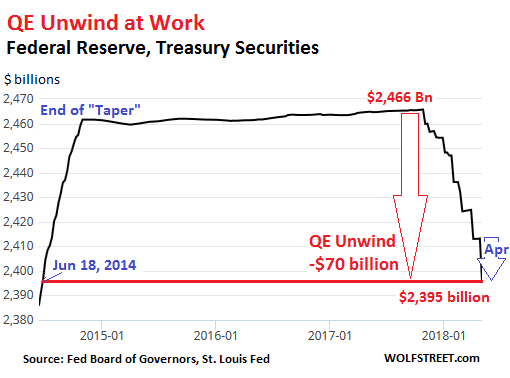
Just like the Fed “tapered” its monthly QE purchases in 2014 before ending them altogether in October that year, the Fed is ramping up the QE Unwind in a similar manner, but somewhat more slowly:
The stair-step pattern in the chart above is caused by how the Fed unloads securities. It doesn’t sell them outright but allows them to “roll off” when they mature. Treasuries mature mid-month or at the end of the month. Hence the stair-steps. In April, no Treasuries on the Fed’s balance sheet matured mid-month. But at the end of April, $30.4 billion matured, and that’s when the action took place.
The Fed replaced $12.8 billion of the maturing Treasuries with new ones directly via its arrangement with the Treasury Department that cuts out its primary dealers and Wall Street. In other words, those $12.8 billion were “rolled over.” But it did not replace $17.6 billion of maturing Treasuries. They “rolled off.” The blue arrow in the chart above shows the April 30 roll-off.
Mortgage-backed securities
Residential MBS are different from regular bonds. Holders receive principal payments on a regular basis as the underlying mortgages are paid down or are paid off. At maturity, the remaining principal is paid off. Over the years, to keep the MBS balance from declining, the New York Fed’s Open Market Operations (OMO) has been continually buying MBS.
But settlement of those trades occurs two to three months later. The Fed books the trades on an as-settled basis. The time lag between the trade and settlement causes the large weekly fluctuations on the Fed’s balance sheet. And it also delays when MBS that “rolled off” actually disappear from the balance sheet [my detailed explanation of further complexities is here].
These timing mismatches cause the jagged line in the chart below. So we’re looking for lower highs and lower lows. Today’s balance sheet reflects MBS that matured somewhere around January and February, when $8 billion in MBS were supposed to have rolled off per month.
Today’s balance fell by $9.5 billion, to $1,744.9 billion, from low to low over the past month. This “roll off” pace is up 70% from March, when $5.6 billion rolled off.
In total, the balance of MBS shrank by $25.5 billion from low to low since the beginning of the QE Unwind. So the roll-offs from earlier months are starting to show up on the balance sheet:

The Fed’s total assets
The QE-Unwind only relates to Treasuries and MBS. Since the beginning of the QE Unwind, they dropped $70.3 billion and $25.5 billion respectively for a combined decline of $95.8 billion.
The Fed has other roles that can impact assets and liabilities of the balance sheet. For example, it acts as the bank of the US Treasury Department and holds “Foreign Official Deposits” by other central banks and government entities. But these and other activities are unrelated to QE or the QE-Unwind.
Total assets on the Fed’s balance sheet dropped by $30 billion in April, and by $104 billion since the beginning of the QE-Unwind, to $4,356 billion. This is the lowest since June 11, 2014. Note that total assets are now down by $160 billion from the peak in January 2015:
The pace of the QE Unwind has accelerated sharply in April, as planned. And it’s unlikely that the Fed will try to prop up the stock market by pausing its QE Unwind machine, even during a sell off. The Fed is targeting “elevated” asset prices, and sell-offs are part of the deal, as long as panic doesn’t freeze up the credit markets, as it did during the Financial Crisis. But currently, credit market conditions are ultra-loose as a result of years of QE and zero-interest-rate policy. So the QE Unwind has a big job ahead to reverse part of what QE has done, which is what “balance sheet normalization” ultimately means.