Those counting on the Fed’s endless “Not-QE” or whatever to inflate the market might be disappointed.
By Wolf Richter for WOLF STREET.
The Fed had doused the market with $410 billion in liquidity between September and January 1 through its repo operations and its T-bill purchases. Market hype had expected this blistering pace of money-printing to continue, but wait… While T-bill purchases continue, the repos on the Fed’s balance sheet are getting unwound, its mortgage-backed securities (MBS) continue to fall, and total assets on its balance sheet fell to the lowest level since mid-December.
Repos drop.
Under these repurchase agreements, the Fed offers to buy Treasury securities, MBS, and agency securities from counterparties with an agreement to sell those securities back to the counterparties at a set price on a specific date, such as the next day (overnight repos) or in 14 days or some other period (term repos). When a repurchase agreement matures, the Fed takes back the money it had handed out and returns the securities to the counterparties. This zeros out that particular repo on the Fed’s balance sheet.
When the Fed buys securities under a repurchase agreement, the amount it pays adds liquidity to the market. When that repo unwinds, and the Fed gets its cash back and returns the securities, it drains this liquidity from the market.
Every day, old repos unwind. And every day, the Fed offers new repos. This is a constant in-and-out. The balance changes every day, but it has been on an uneven decline since the peak on January 1.
The total amount of repos on the Fed’s weekly balance sheet as of January 22, released this afternoon, has now fallen by $70 billion from the peak on January 1 ($256 billion), to $186 billion. This is below where it had first been on October 16:
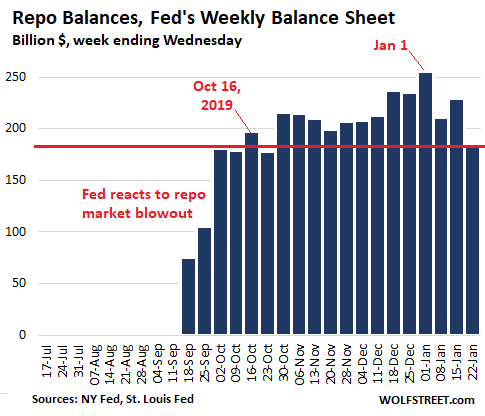
The $43-billion drop in repos over the past seven days was largely due to a 32-day $50-billion repo, dating from December 16, that unwound on January 17. It was not replaced by another 30-day repo, and there are no more 30-day repos on the Fed’s repo schedule or balance sheet.
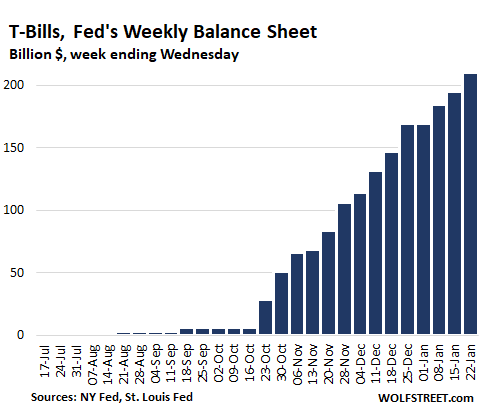
T-Bills surge.
Last year before the repo market blew out, the Fed said in a series of announcements that it would replace some of the maturing Treasury securities with T-bills (Treasuries with maturities of one year or less) and that it would replace some of the MBS with T-bills, if the roll-off of MBS exceeds its monthly cap of $20 billion. The stated purpose was to replace some of its longer-dated securities with short-term securities. Then the repo market blew out.
As part of its repo-market bailout, the Fed announced that it would buy about $60 billion a month in T-bills to push up the excess reserves that banks have deposited at the Fed, under the assumption that when excess reserves reach a certain level, the banks would once again eagerly lend to the repo market without hiccup. And then it would stop this $60-billion a month program. Since October, the Fed has purchased $210 billion in T-bills:
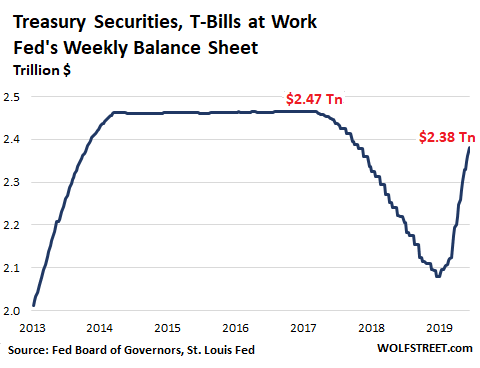
Total Treasury securities dominated by T-Bills.
Given the explosion in T-Bills from near-zero to $210 billion in four months, total Treasury securities (which include T-Bills) rose to $2.38 trillion, the highest since May 2018:
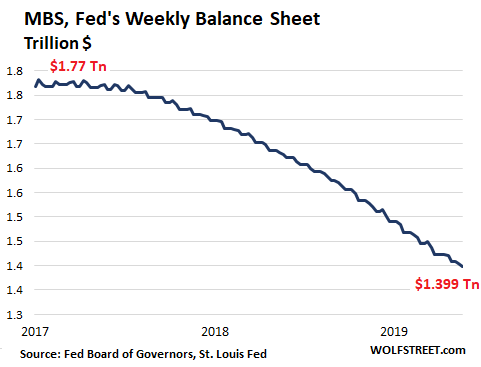
The Fed sheds MBS.
The Fed has made clear with numerous pronouncements in 2019 that it wants to get rid of its holdings of MBS at a rate not exceeding $20 billion a month (the “cap”). And it’s sticking to its plan.
The Fed doesn’t actually sell its MBS. Like all holders of MBS, it receives pass-through principal payments as the underlying mortgages are paid down or are paid off. About 95% of the MBS on the Fed’s balance sheet mature in 10 years or more, and the current “runoff” is almost entirely due to these pass-through principal payments that have been fired up by lower interest rates over the past year that triggered a surge of refis.
Over the first three weekly balance sheets in January, the net balance of MBS on the Fed’s balance sheet dropped by $10 billion to $1.399 trillion, below where they’d first been in October 2013:
Total Assets tick down.
Falling repos, surging T-bills, slowly rising coupon Treasury securities, falling MBS, and other activities reflected on the Fed’s balance sheet, all combined, have caused total assets to decline by $30 billion over the seven-day period to $4.146 trillion. This is down by $20 billion from the balance sheet four weeks ago, on December 25:
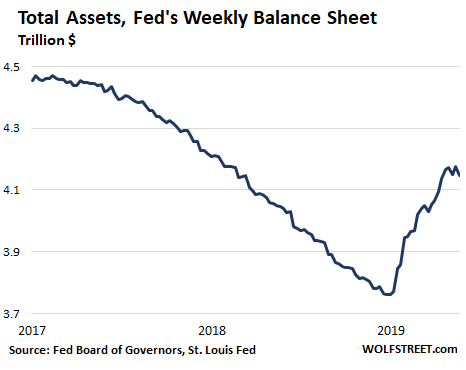
The various elements on the asset side of the Fed’s balance sheet are pulling in different directions: Repos shrank, T-Bills surged, coupon Treasuries ticked up, MBS fell, and on net, total assets are now down by $20 billion from four weeks ago.
The level of assets fluctuates from week to week, and the movement of one week doesn’t indicate a trend.
But the comparison of the past four weeks, when total assets fell by $20 billion, with the prior four weeks, when total assets surged by $123 billion, indicates that there has been a change — and more than a nuance of change — in what the Fed has been doing after it got the repo market through December 31 without blowing out. And that expected endless flood of new liquidity seems to have largely dried up.
Here is who got what from the Fed in 2019, including dividends. Read… Fed Pays $35 Billion to Banks, $6 Billion to Reverse-Repo Counterparties in Interest for 2019, Remits $55 billion to US Treasury