by Umar Farooq
Chart 1: Record high level of uncertainty in the markets
The number of news stories that contain the word “uncertainty” has reached a record, according to Bloomberg data, which include stories published from multiple sources.
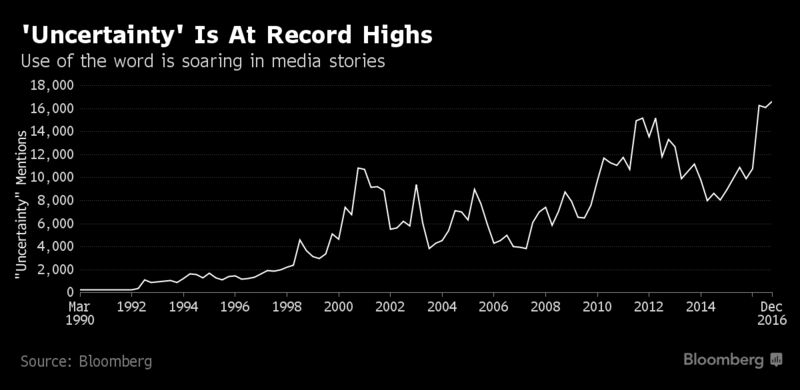
Chart 2: Record high level of difference between the VIX and Global Economic Policy Uncertainty Index
The Chicago Board of Options Exchange Volatility Index, a gauge of investor anxiety known as the VIX, has been unusually calm in recent months, prompting a swell of analyst commentary about Wall Street’s stubborn “fear gauge.” Look to Washington, however, and you’ll find plenty of disquiet among policymakers and politicians. The difference between the VIX and the Global Economic Policy Uncertainty Index is now at its highest level on record.
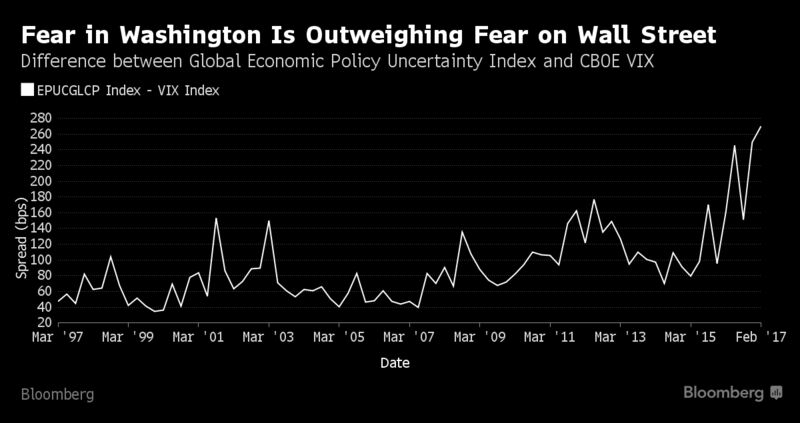
Chart 3: Investors are more worried about the tail risk with high demand for plunge protection
One theory as to why the VIX has been muted recently is that stocks are increasingly moving in different directions under President Trump, suppressing realized correlation and with it, index volatility. Those looking for evidence of market nervousness must look at the CBOE Skew Index, which measures the price of buying protection against more dramatic moves in the S&P 500. On that basis, investors appear to be concerned about tail risks.
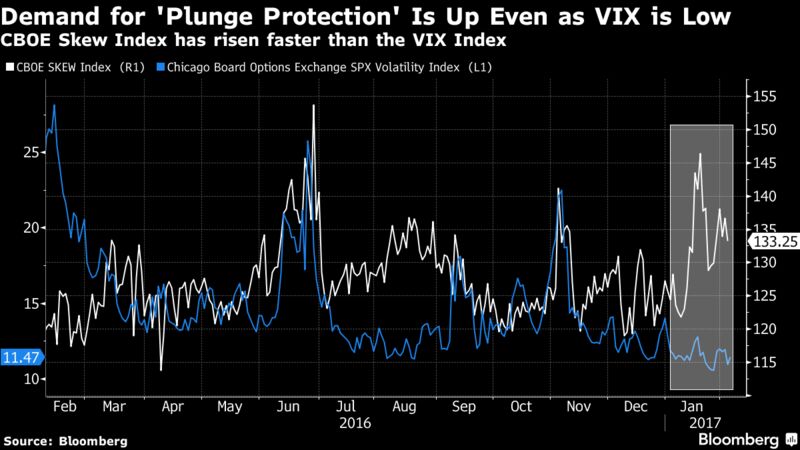
Chart 4: Gold is in demand
Gold has long been used as a hedge and money has been pouring into exchange-traded funds tracking the precious metal. Again, those inflows have not been matched by movement in the VIX, and a gap has opened up between the two measures.
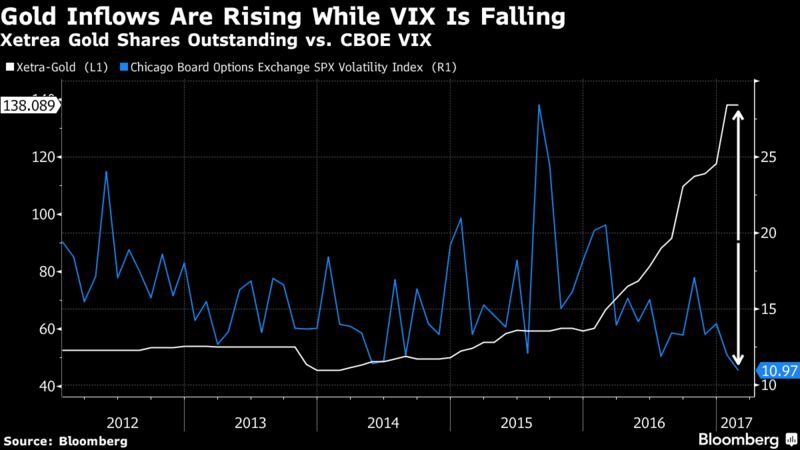
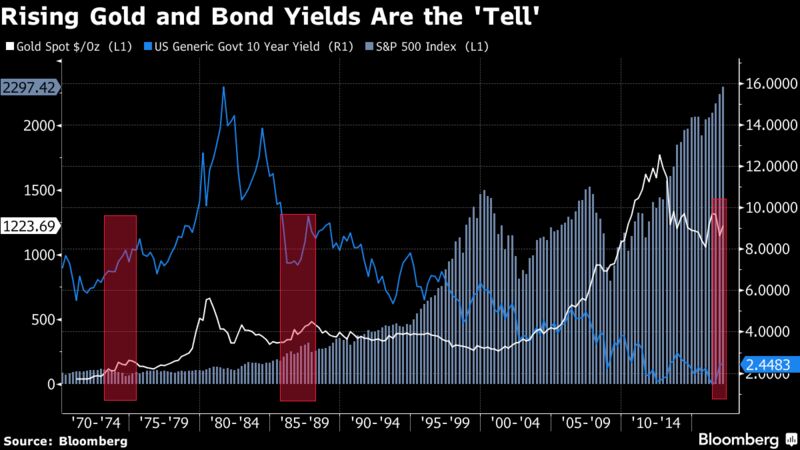
Chart 5: Watch out for the bond yield and gold prices combo
Gold may prove the “tell,” according to Chris Flanagan, also at Bank of America. He advises investors to watch “for the combo of rising yields and rising gold prices to signal impending market volatility.” Three consecutive quarters of rising benchmark bond yields and gold prices preceded previous market falls including the 1973-1974 bond market crash and Black Monday in 1987, he says. The yield on the benchmark 10-year U.S. Treasury has risen to 2.44 percent from 1.77 percent since Trump’s election win. Gold has moved sideways.
Source: Bloomberg
Wait till the market crash’s to buy gold and silver, they always go down when the market is dropping big. Margin calls cancel all contracts with a big market drops. With a 30 to 50% drop in market value suddenly gold could see 700 again. But only for a very short amount of time… imho that is, lol..
??of course with Nibiru passing this summer all bets are off this year,
seek salvation an Pray is all u really have at this point!