by Harry Dent of Economy & Markets
I sent a market update to Boom & Bust subscribers in our 5 Day Forecast last Monday. I explained that stocks saw their biggest correction since late 2011, which makes that a 4th wave correction leading into a 5th wave final blow-off rally… what I have been calling the Dark Window scenario. My target is around 10,000 on the leading index, the Nasdaq, and around 33,000 on the Dow.
It’s likely we saw the first wave up into early May with two more strong surges ahead. We have just made new highs on the Dow and S&P 500, with the Nasdaq coming close to a new high.
Is this a breakout in the next wave up?
I think it’s likely…
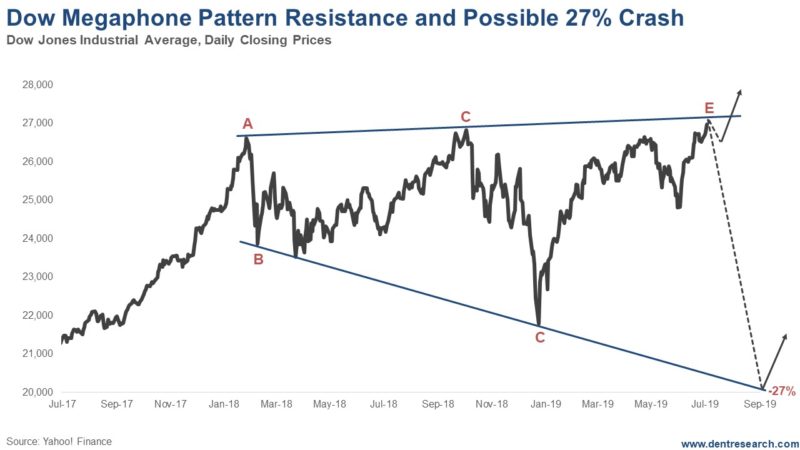
But there is a pattern that still warrants near-term caution…

Note that this megaphone pattern sees higher highs and lower lows until the final breakdown projected to about 20,000 on the Dow. The top trend-line would be around 27,300 on the Dow and 3,025 on the S&P 500, just a little over 1% above the market’s projected open today.
The Final Dark Window
This pattern does not have to play out on the downside. But if it does, it would suggest a new correction of as high as 27% in the Dow. That could take the Nasdaq down to its “line in the sand” at around 5,700. That’s down about 30%. (I covered that original analysis and forecast from early this year on Monday).
If that level holds, we could still see that final Dark Window blow-off rally, but to more like 9,600 – that would be a near 70% rally in just several months, instead of the 25% rally projected from here, and 30%-plus after a minor correction ahead.
If there is another total breakdown in the China trade deal, and perhaps some dangerous tensions with Iran, we could see this steeper correction in the next few months.
A More Likely Forecast
However, the more likely scenario is that this pattern of slightly higher highs simply creates resistance near term and a more minor correction into mid-July and then we see that next strong surge up on the way to Dow 33,000 and Nasdaq 10,000-plus, likely into January of 2020, or March at the latest.
The first crash after that is likely to be 40%-plus in two or three months, or a Nasdaq back around 6,000 or lower. That would break the line in the sand and will throw a monkey wrench into the election!
A pullback and then a clear break above this top trendline would be the sign that we are on our way up.
A sharper correction nearer-term and follow-through into August on the downside would suggest the stronger-correction scenario.
Adam O’Dell’s indicators are still supporting the bull market for now. So, the bullish breakout after a minor correction is still the more likely scenario…
And bitcoin still looks to be rocketing towards $32,000, after hitting near $14,000 recently. This pullback is not likely to last long.
And If You’re Thinking Of Buying Gold, Or If You Already Own Gold
My forecast shows gold will likely go as low as $700 an ounce starting now thru to 2023…
And if history’s anything to go by, it could go as low as $250 an ounce before this doomed yellow metal sees any kind of turn around.
In every historical case I’ve studied, the same trend has unfolded. Every. Single. One. There’s no reason to believe it will be any different this time, and you’ll learn all the details when you read How to Survive (and Thrive) During the Great Gold Bust Ahead.
Let me make this absolutely clear: A devastating 83% decline in the price of gold is highly likely in the next five to eight years. That’s why I’d like you to secure your copy of my latest book immediately.
You need to see what’s in store for gold.
And you need to take action now!