Wolf Richter wolfstreet.com, http://www.amazon.com/author/wolfrichter
But apartment rents in 10 other cities surge 10% to 15%.
In the most expensive US markets, apartment rents hit a ceiling some time ago, in some cases four years ago, and have dropped from those highs, as tenants have reached their limit. That this wasn’t a brief fluke, after which rents would surge again in those markets, is becoming increasingly apparent. At the same time, sharp rent increases have moved down to less expensive markets.
In Seattle, the median asking rent for one-bedroom apartments in July fell 3.1% from a year ago to $1,900 and is down 4.5% from the peak in May 2018. The median asking rent for two-bedroom apartments fell 4.1% from a year ago to $2,350, and is down 11.3% from the peak in April 2016.
Clearly, after years of surging rents in Seattle, a ceiling has been hit. At the same time, the phenomenal boom in apartment and condo construction over the past few years has put plenty of supply on the market – though it’s all high-end, and therefore mostly the wrong supply. And those vacant high-end units that need to be filled are putting downward pressure on the entire scale.
In San Francisco, the median asking rent for one-bedroom apartments rose 2.9% in July compared to a year ago, to $3,600. But this was below its old record set nearly four years ago in October 2015 ($3,670). The median asking rent for a two-bedroom apartment ticked up 1.3% year-over-year to $4,790 – also below the October 2015 peak ($5,000).
San Francisco’s are the most ridiculously high rents among large US cities. Locally, it’s considered part of the “Housing Crisis,” which has many aspects, including that 1% of the population is homeless. Despite all the hoopla and the money in San Francisco, rent increases have been smacking into basic market forces starting in late 2015, and those market forces haven’t abated since.
In Los Angeles, the median asking rent for 1-BR apartments fell 4.3% from a year ago to $2,230 and is down nearly 8% from the peak in December last year. 2-BR rents, at $3,190, are down a smidgen from a year ago and down 3.6% from their peak in June 2018.
In San Diego, the median 1-BR rent fell 5.4% from a year ago, to $1,750, and is down 10.3% from the peak in December 2018. And 2-BR rents, at $2,400, are down 4.8% from the peak in October last year. Rents are down similarly in Santa Ana (Orange County) and Long Beach.
In New York City, a vast and diverse market with some of the most expensive neighborhoods in the country, the median asking rent for a one-bedroom apartment peaked over three years ago, in March 2016 ($3,370). In July 2019, the 1-BR median asking rent was $3,050. While up 5.2% from July last year, it was down nearly 10% from the peak over three years ago. The median asking rent for two-bedroom apartments rose 4.9% to $3,450, but was still down 13% from the peak in March 2016.
In terms of serious rent declines at among the most expensive and largest rental markets, Chicago and Honolulu stand out.
In Chicago, a huge market that spans the spectrum, the median asking rent for 1-BR apartments, at $1,470 in July, has plunged 28% from its peak in October 2015. And the median 2-BR rent, at $1,800, has plunged 32% from the peak in September 2015.
In Honolulu, the median rent for 1-BR apartments ($1,590) and for 2-BR apartments ($2,200) have both plunged 25% from their peak in early 2015.
The table below shows the 16 most expensive major rental markets in the US. The shaded area indicates peak rents and the changes since then. Boston and Ft. Lauderdale are the only markets on this list whose median asking rents reached a new highs in July:
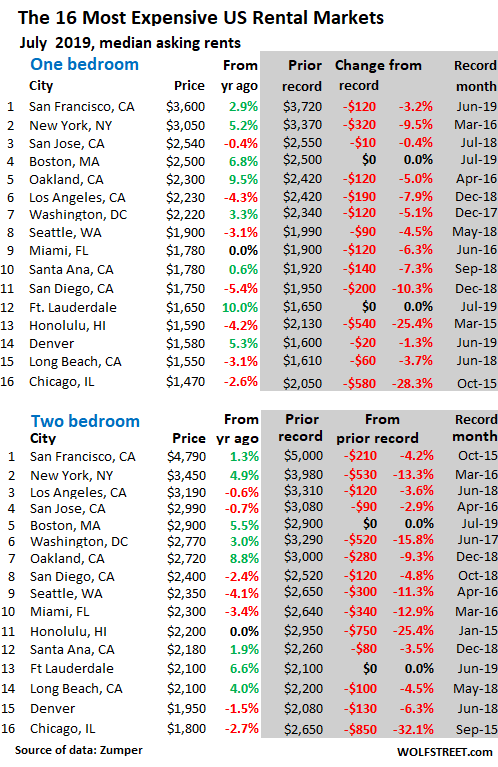
“Asking rent” is the amount advertised in the listing. This is a measure of the current market for people looking to rent. It is not a measure of rents that long-time tenants actually pay. “Median” means: half of the advertised rents are higher, and half are lower.
The data is based on over 1 million active listings in the 100 largest markets that Zumper combs through, including third-party listings from Multiple Listings Service (MLS), of apartments-for-rent in apartment buildings, including new construction. But it excludes single-family houses and condos for rent. It also excludes rooms, efficiency apartments, and apartments with three or more bedrooms. Incentives, such as “one month free,” are also excluded.
The 15 Cities with the largest rent declines:
What was red-hot once is now ice-cold. Here are the 15 cities that in July experienced the largest year-over-year declines in median asking rents for 1-BR apartments. At the top is Nashville, which had been a red-hot rental market until this year when market forces pulled the ripcord. Also note Houston and Dallas on the list — and another formerly red-hot market, Portland:
| City | 1-BR $ | Y/Y % | 2-BR $ | Y/Y % |
| Nashville, TN | 1,170 | -14.6% | 1,350 | -6.9% |
| Baltimore, MD | 1,180 | -14.5% | 1,420 | -15.0% |
| Columbus, OH | 700 | -10.3% | 1,100 | 3.8% |
| Houston, TX | 1,150 | -10.2% | 1,400 | -12.5% |
| Buffalo, NY | 990 | -8.3% | 1,180 | -15.7% |
| Portland, OR | 1,350 | -8.2% | 1,700 | -1.7% |
| Lincoln, NE | 670 | -8.2% | 890 | -7.3% |
| Philadelphia, PA | 1,380 | -8.0% | 1,700 | 0.0% |
| Bakersfield, CA | 730 | -6.4% | 900 | 1.1% |
| Madison, WI | 1,200 | -6.3% | 1,320 | -7.0% |
| Des Moines, IA | 810 | -5.8% | 860 | -7.5% |
| Chesapeake, VA | 990 | -5.7% | 1,220 | 1.7% |
| San Diego, CA | 1,750 | -5.4% | 2,400 | -2.4% |
| Dallas, TX | 1,230 | -5.4% | 1,700 | -4.5% |
| Lexington, KY | 750 | -5.1% | 980 | 4.3% |
The 15 Cities with the biggest rent increases:
But rents are soaring in some of the top 100 major rental markets, with 10 markets experiencing double-digit year-over-year surges in median asking rents for 1-BR apartments. Oakland is on this list, but note that its 1-BR asking rent, despite the surge, is still down 5% from its peak in April 2016, see table above (if your smartphone clips the right side of the table, hold your device in landscape position):
| City | 1-BR $ | Y/Y % | 2-BR $ | Y/Y % |
| Chandler, AZ | 1,210 | 15.2% | 1,460 | 14.1% |
| Scottsdale, AZ | 1,430 | 13.5% | 2,010 | 3.1% |
| Fresno, CA | 1,000 | 12.4% | 1,140 | 0.9% |
| Gilbert, AZ | 1,210 | 12.0% | 1,470 | 9.7% |
| Charlotte, NC | 1,320 | 11.9% | 1,420 | 10.1% |
| Spokane, WA | 850 | 11.8% | 1,000 | 6.4% |
| Glendale, AZ | 860 | 11.7% | 1,100 | 6.8% |
| Syracuse, NY | 970 | 11.5% | 1,050 | -6.3% |
| Indianapolis, IN | 750 | 10.3% | 810 | 0.0% |
| Fort Lauderdale, FL | 1,650 | 10.0% | 2,100 | 6.6% |
| Oakland, CA | 2,300 | 9.5% | 2,720 | 8.8% |
| Providence, RI | 1,500 | 9.5% | 1,580 | 3.9% |
| Sacramento, CA | 1,300 | 8.3% | 1,500 | 6.4% |
| Reno, NV | 910 | 8.3% | 1,310 | 7.4% |
| Tulsa, OK | 660 | 8.2% | 810 | 5.2% |
But the drama gets averaged away on a national basis.
All of these soaring, plunging, and stable rents thrown into the same bucket produce the national averages: with the median asking rent for 1-BR apartments rising 2.1% to a new record of $1,233, and the median asking rent for 2-BR apartments rising 2.2% to a record of $1,477.
The largest 100 Cities, by magnitude of 1-BR rent.
Below is Zumper’s list of the top 100 most expensive major rental markets, sorted by 1-BR asking rents in July, with year-over-year percent changes (Y/Y %). You can use your browser’s search function to find a city. If your smartphone clips the right side of the table, hold your device in landscape position:
| City | 1-BR $ | Y/Y % | 2-BR $ | Y/Y % | |
| 1 | San Francisco, CA | 3,600 | 2.9% | 4,790 | 1.3% |
| 2 | New York, NY | 3,050 | 5.2% | 3,450 | 4.9% |
| 3 | San Jose, CA | 2,540 | -0.4% | 2,990 | -0.7% |
| 4 | Boston, MA | 2,500 | 6.8% | 2,900 | 5.5% |
| 5 | Oakland, CA | 2,300 | 9.5% | 2,720 | 8.8% |
| 6 | Los Angeles, CA | 2,230 | -4.3% | 3,190 | -0.6% |
| 7 | Washington, DC | 2,220 | 3.3% | 2,770 | 3.0% |
| 8 | Seattle, WA | 1,900 | -3.1% | 2,350 | -4.1% |
| 9 | Miami, FL | 1,780 | 0.0% | 2,300 | -3.4% |
| 9 | Santa Ana, CA | 1,780 | 0.6% | 2,180 | 1.9% |
| 11 | San Diego, CA | 1,750 | -5.4% | 2,400 | -2.4% |
| 12 | Anaheim, CA | 1,730 | 3.0% | 2,230 | 5.2% |
| 13 | Fort Lauderdale, FL | 1,650 | 10.0% | 2,100 | 6.6% |
| 14 | Honolulu, HI | 1,590 | -4.2% | 2,200 | 0.0% |
| 15 | Denver, CO | 1,580 | 5.3% | 1,950 | -1.5% |
| 16 | Long Beach, CA | 1,550 | -3.1% | 2,100 | 4.0% |
| 17 | Providence, RI | 1,500 | 9.5% | 1,580 | 3.9% |
| 18 | Chicago, IL | 1,470 | -2.6% | 1,800 | -2.7% |
| 19 | New Orleans, LA | 1,430 | 6.7% | 1,530 | 0.0% |
| 19 | Scottsdale, AZ | 1,430 | 13.5% | 2,010 | 3.1% |
| 21 | Minneapolis, MN | 1,400 | 0.7% | 1,800 | -3.2% |
| 22 | Atlanta, GA | 1,390 | -4.8% | 1,750 | -6.4% |
| 23 | Philadelphia, PA | 1,380 | -8.0% | 1,700 | 0.0% |
| 24 | Portland, OR | 1,350 | -8.2% | 1,700 | -1.7% |
| 25 | Charlotte, NC | 1,320 | 11.9% | 1,420 | 10.1% |
| 26 | Orlando, FL | 1,300 | 4.0% | 1,470 | 2.1% |
| 26 | Sacramento, CA | 1,300 | 8.3% | 1,500 | 6.4% |
| 28 | Dallas, TX | 1,230 | -5.4% | 1,700 | -4.5% |
| 29 | Chandler, AZ | 1,210 | 15.2% | 1,460 | 14.1% |
| 29 | Gilbert, AZ | 1,210 | 12.0% | 1,470 | 9.7% |
| 31 | Austin, TX | 1,200 | 0.8% | 1,540 | 4.1% |
| 31 | Madison, WI | 1,200 | -6.3% | 1,320 | -7.0% |
| 33 | Aurora, CO | 1,190 | 4.4% | 1,500 | 2.7% |
| 34 | Baltimore, MD | 1,180 | -14.5% | 1,420 | -15.0% |
| 35 | Nashville, TN | 1,170 | -14.6% | 1,350 | -6.9% |
| 35 | Plano, TX | 1,170 | -0.8% | 1,630 | 3.8% |
| 37 | Fort Worth, TX | 1,160 | 5.5% | 1,300 | -0.8% |
| 38 | Houston, TX | 1,150 | -10.2% | 1,400 | -12.5% |
| 38 | Newark, NJ | 1,150 | 2.7% | 1,500 | 7.9% |
| 40 | Irving, TX | 1,140 | 0.0% | 1,500 | -2.6% |
| 41 | Henderson, NV | 1,130 | 6.6% | 1,350 | 8.9% |
| 41 | Tampa, FL | 1,130 | -2.6% | 1,320 | -4.3% |
| 43 | Durham, NC | 1,110 | -1.8% | 1,270 | -3.1% |
| 44 | St Petersburg, FL | 1,100 | 5.8% | 1,550 | 3.3% |
| 44 | Virginia Beach, VA | 1,100 | 6.8% | 1,230 | 2.5% |
| 46 | Pittsburgh, PA | 1,080 | -0.9% | 1,300 | -3.0% |
| 46 | Raleigh, NC | 1,080 | 8.0% | 1,200 | 0.8% |
| 48 | Richmond, VA | 1,070 | 1.9% | 1,230 | -1.6% |
| 48 | Salt Lake City, UT | 1,070 | 2.9% | 1,370 | 1.5% |
| 50 | Fresno, CA | 1,000 | 12.4% | 1,140 | 0.9% |
| 50 | Phoenix, AZ | 1,000 | 3.1% | 1,250 | 5.0% |
| 52 | Buffalo, NY | 990 | -8.3% | 1,180 | -15.7% |
| 52 | Chesapeake, VA | 990 | -5.7% | 1,220 | 1.7% |
| 52 | Las Vegas, NV | 990 | 6.5% | 1,150 | 0.0% |
| 55 | Milwaukee, WI | 970 | 6.6% | 1,020 | -8.1% |
| 55 | Syracuse, NY | 970 | 11.5% | 1,050 | -6.3% |
| 57 | Boise, ID | 960 | 2.1% | 1,100 | 12.2% |
| 58 | Kansas City, MO | 950 | 0.0% | 1,070 | -2.7% |
| 59 | Anchorage, AK | 930 | 3.3% | 1,150 | 4.5% |
| 59 | Colorado Springs, CO | 930 | 4.5% | 1,200 | 7.1% |
| 61 | Jacksonville, FL | 920 | -3.2% | 1,050 | -3.7% |
| 62 | Mesa, AZ | 910 | 1.1% | 1,160 | 12.6% |
| 62 | Reno, NV | 910 | 8.3% | 1,310 | 7.4% |
| 64 | Louisville, KY | 900 | 4.7% | 960 | -2.0% |
| 65 | San Antonio, TX | 890 | -2.2% | 1,100 | -5.2% |
| 66 | Glendale, AZ | 860 | 11.7% | 1,100 | 6.8% |
| 67 | Corpus Christi, TX | 850 | -4.5% | 1,070 | 0.0% |
| 67 | Spokane, WA | 850 | 11.8% | 1,000 | 6.4% |
| 69 | Rochester, NY | 840 | 0.0% | 980 | -3.9% |
| 70 | Laredo, TX | 830 | 0.0% | 880 | -11.1% |
| 70 | Omaha, NE | 830 | -2.4% | 1,050 | -4.5% |
| 72 | Arlington, TX | 820 | 1.2% | 1,090 | 0.9% |
| 72 | Baton Rouge, LA | 820 | -1.2% | 910 | 0.0% |
| 74 | Cleveland, OH | 810 | 1.3% | 870 | -3.3% |
| 74 | Des Moines, IA | 810 | -5.8% | 860 | -7.5% |
| 76 | Knoxville, TN | 800 | -3.6% | 900 | -2.2% |
| 76 | Norfolk, VA | 800 | -2.4% | 1,070 | 7.0% |
| 78 | St Louis, MO | 790 | -1.3% | 1,150 | -1.7% |
| 79 | Chattanooga, TN | 780 | 1.3% | 890 | 9.9% |
| 79 | Cincinnati, OH | 780 | -3.7% | 1,120 | 0.9% |
| 81 | Winston Salem, NC | 770 | 1.3% | 830 | -1.2% |
| 82 | Tallahassee, FL | 760 | 4.1% | 880 | 3.5% |
| 83 | Augusta, GA | 750 | 4.2% | 830 | 0.0% |
| 83 | Indianapolis, IN | 750 | 10.3% | 810 | 0.0% |
| 83 | Lexington, KY | 750 | -5.1% | 980 | 4.3% |
| 86 | Bakersfield, CA | 730 | -6.4% | 900 | 1.1% |
| 86 | Greensboro, NC | 730 | 0.0% | 850 | 1.2% |
| 86 | Memphis, TN | 730 | -1.4% | 810 | 3.8% |
| 89 | Albuquerque, NM | 700 | 7.7% | 850 | 1.2% |
| 89 | Columbus, OH | 700 | -10.3% | 1,100 | 3.8% |
| 91 | Oklahoma City, OK | 690 | -2.8% | 890 | 6.0% |
| 92 | Lincoln, NE | 670 | -8.2% | 890 | -7.3% |
| 93 | Tulsa, OK | 660 | 8.2% | 810 | 5.2% |
| 94 | El Paso, TX | 650 | 3.2% | 790 | 3.9% |
| 94 | Shreveport, LA | 650 | 1.6% | 700 | -5.4% |
| 94 | Tucson, AZ | 650 | 3.2% | 890 | 4.7% |
| 97 | Lubbock, TX | 630 | 5.0% | 800 | 2.6% |
| 98 | Detroit, MI | 610 | 1.7% | 690 | 0.0% |
| 98 | Wichita, KS | 610 | 0.0% | 750 | 0.0% |
| 100 | Akron, OH | 550 | -3.5% | 710 | -5.3% |
Seattle House prices fell year-over-year, as did New York and San Francisco Bay Area condo prices. Los Angeles, San Diego ticked up. Denver and Boston jumped to new highs. Las Vegas, Miami, Phoenix are aspiring to the crazy peaks of Housing Bubble 1. Read… The Most Splendid Housing Bubbles in America, July Update: Year-Over-Year Declines Spread to Seattle