Wolf Richter wolfstreet.com, http://www.amazon.com/author/wolfrichter
But this time it’s not a result of a tech bust. That hasn’t happened yet.
Housing inventory listed for sale in the two counties that make up Silicon Valley – San Mateo County and Santa Clara County – and in the county of San Francisco, surged by 113% in December compared to December last year, to 2,691 active listings, the most for any December since 2013, when the area emerged from Housing Bust 1. December is usually near the annual low point in terms of listings, but not in 2018, when listings in December were higher than in each of the first five months that year.
The chart below shows the year-over-year percentage change in active listings. The bars in red denote when the underlying dynamics of the housing market changed direction (all data via the National Association of Realtors at realtor.com):
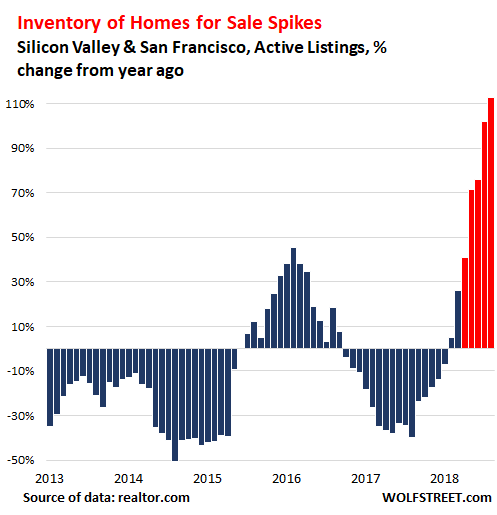
The shift is now becoming more obvious in Silicon Valley and San Francisco, among the most expensive housing markets in the US with median prices for single-family houses ranging from about $1.2 million in Santa Clara to about $1.5 million in San Mateo.
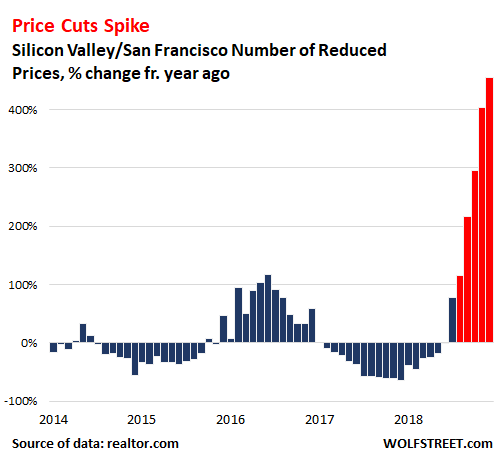
With inventories for sale rising, as sales are slowing, a whiff of competition is settling in among sellers, who have to determine where the market is today, not where it was last year, and if they want to sell their property, they have to price it where the buyers are. But buyers aren’t where they were a year ago, and the bidding wars have receded into history, and mortgage rates have jumped from a year ago. The right property, priced right will sell. But if it’s priced off the market, it will likely sit. This is starting to sink in. And sellers are cutting their asking prices.
In December, the number of properties on the market with price cuts in Silicon Valley and San Francisco combined skyrocketed by 455% from a year earlier to 444. This chart shows the year-over-year percentage change for each month, with the red bars denoting when bubble trouble began:
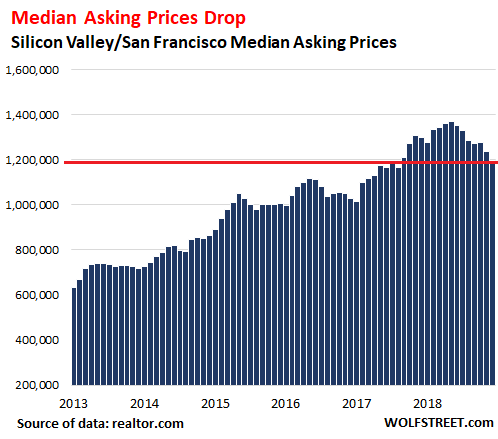
The median asking price for the three counties had peaked in May 2018 at $1.37 million but has since plunged by $170,300 or by 12% from the peak, to $1.2 million. Median asking price means half the properties are listed for more and half are listed for less. It differs from the median selling price at which homes are actually sold. This was the lowest median asking price since August 2017:
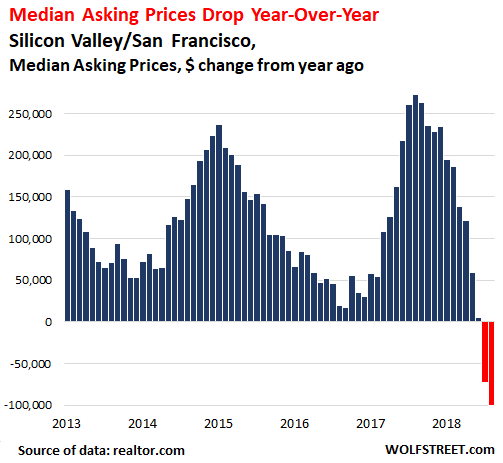
Compared to December last year, the median asking price dropped by $100,000 or by 7.7%. The chart below of year-over-year dollar changes in median asking prices shows to what extent a new sense of reality about the direction of the market has crept into asking prices over the past two months:
And these are still the boom times in Silicon Valley and San Francisco. There is some anecdotal evidence that some of the tech companies are slowing down some moonshots or expansion projects or are cancelling later phases, and some startups have trouble getting funding.
But a slew of massive IPOs are being hyped for 2019 – Uber, Palantir, Lyft, Airbnb, and the like – before the Nasdaq craters, thereby shutting the IPO window. And this tsunami of mega-IPOs was hoped to flood the land with cash, as investors and employees start selling their shares. These hopes still exist, and at least some of those IPOs will happen this year. While the water is a little ruffled, these are still the boom times in the Bay Area.
And that the underlying dynamics of the housing market have changed direction is – this time – not a result of the tech bust. That hasn’t happened yet. Is just the housing market turning on its own.