Last week, John Coumarianos penned an interesting piece discussing the surge in home prices over the last few months. To wit:
“The psychological factors are harder to assess. People aren’t flipping condos for sport the way they were during the bubble when mortgages were available to anyone regardless of whether they had income or assets. Yet it seems there’s a widespread desire to own assets – stocks, bonds, and real estate – regardless of price. It’s not an obviously happy mania, where people are motivated by promises of great wealth. It’s more like a need to be an asset owner in an economy that continues to hurt workers without college degrees and becomes more automated. Nevertheless, the price insensitivity of many buyers is enough to cause concern.”
He is right.
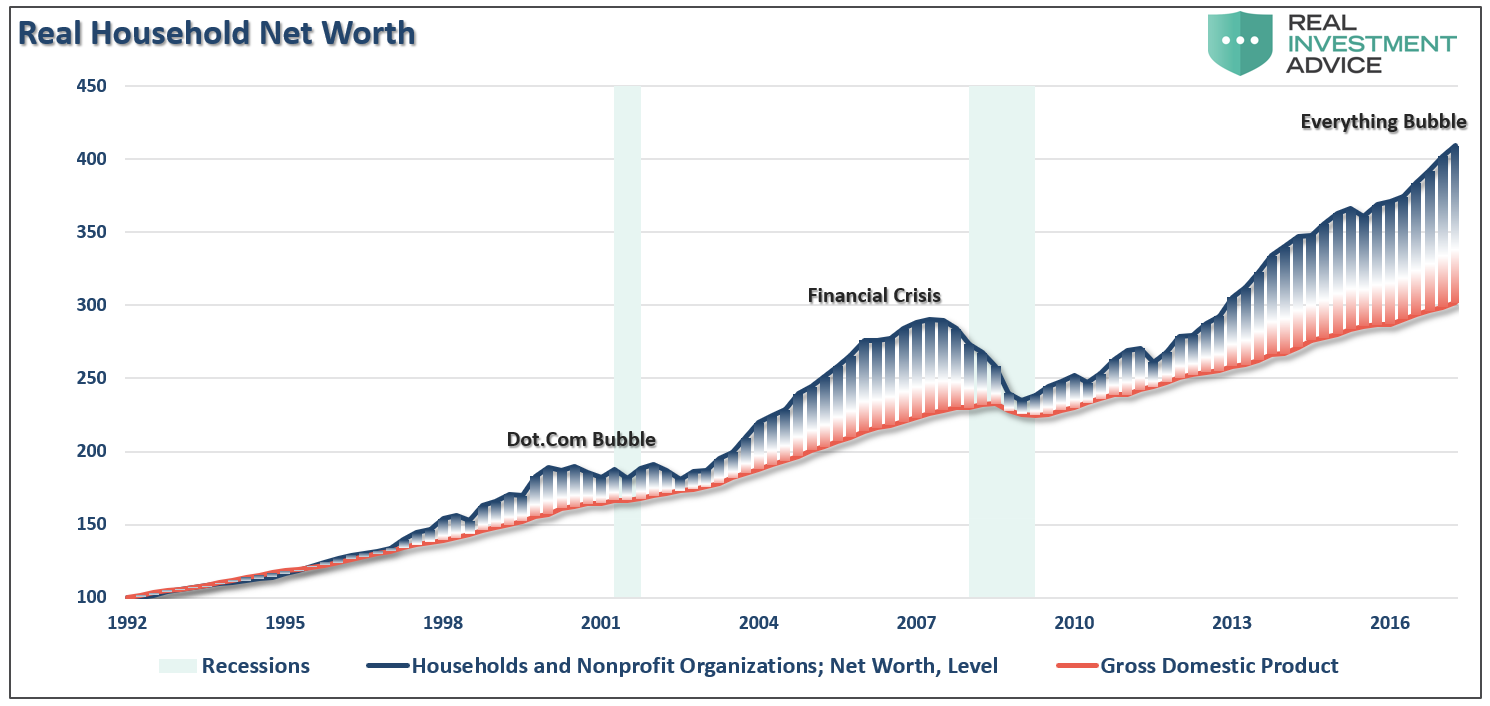
Low rates, weak economic growth, cheap and available credit, and a need for income has inflated the third bubble of this century.
John makes a very interesting point of the potential for the recent bump in housing numbers to be part of the global asset chase.
While, there has been much hoped placed on the “housing recovery story” over the last few years, the hopes of a stronger housing-driven economic recovery has failed to emerge. But, in just the last few months, there has been, at last, an uptick in some of the data.
Is the improvement the beginning of “the” long-awaited housing recovery? Or, is it just the final inflation of a combined asset bubble driven by excess liquidity, cheap credit and a “yield chase” of epic proportions?
Let’s look at the data.
At The Margin
The problem with much of the mainstream analysis is that it is based on the transactional side of housing which only represents what is happening at the “margin.” The economic importance of housing is much more than just the relatively few number of individuals, as compared to the total population, that are actively seeking to buy, rent or sell a home each month.
To understand what is happening in terms of “housing,” we must analyze the “housing market” as a whole rather than what is just happening at the fringes. For this analysis, we can use the data published by the U.S. Census Bureau which can be found here.
Total Housing Units
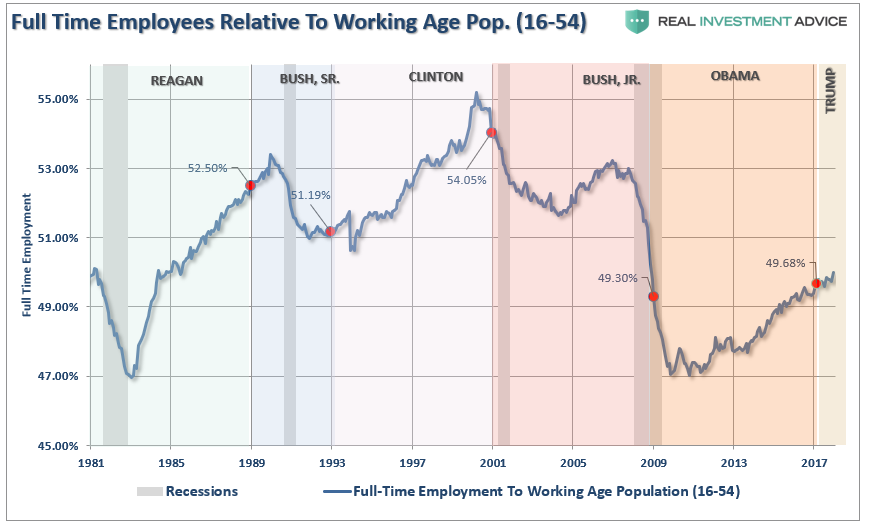
In an economy that is roughly 70% driven by consumption, it is grossly important that the working age population is, well, working. More importantly, as discussed in “Yellen, Employment & Policy Errors“
“This also explains why the labor force participation rate, of those that SHOULD be working (16-54 years of age), remains at the lowest levels since the early 1980’s. This chart alone should give Ms. Yellen pause in her estimations on the strength of the underlying economy.”
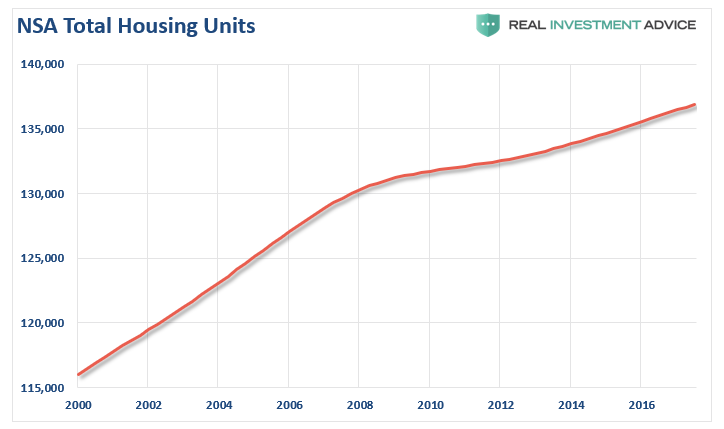
To present some context for the following analysis, we must first have some basis from which to work from. Our baseline for this analysis will be the number of total housing units which, as of Q4-2017, was 136,912,000 units. The chart below shows the historical progression of the seasonally adjusted number of housing units in the United States.
(Note: Importantly, despite data released by the marketing arms of the real estate which suggests that millions of units are being built each year. The reality is that from Q1 of 2009 until Q4 of 2017, there has been a TOTAL increase of just 5,911,000 units. This equates to an average increase of just 657,000 units per year.)
During that same period, the population of the U.S. grew by over 21,125.000 or an average of 2.35 million people per year. More importantly, since in order to own a home, one must have a job, those counted as having a job grew by almost 17-million during the same period.
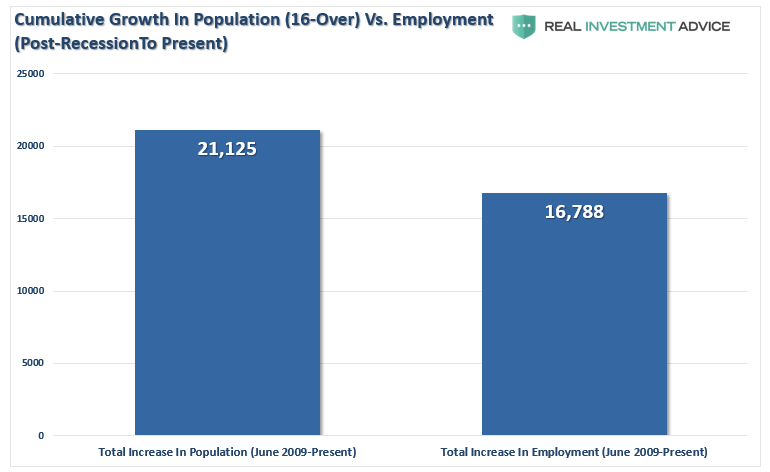
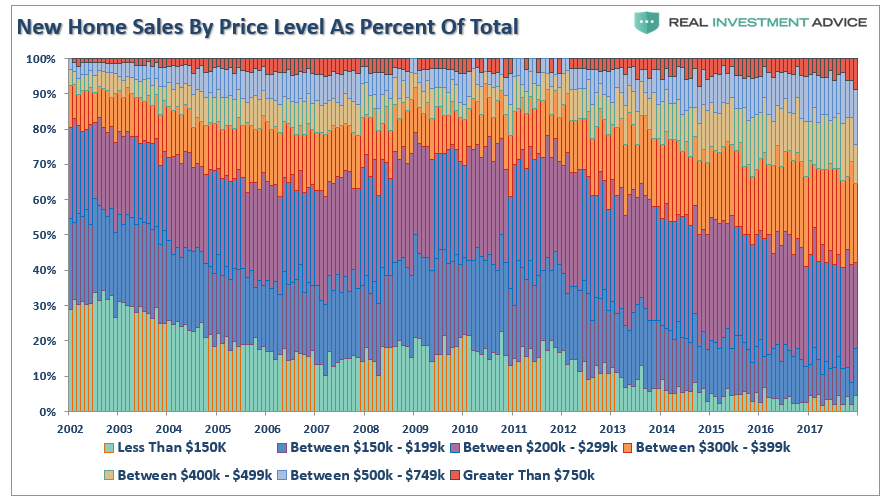
Rising employment and population growth are strong drivers for the housing sector. After all, people have to live somewhere, right? But when we take a look at what homes are being sold, we see a deterioration in the percentage of homes being sold to those that comprise 80% of income and wage earners and an increase in those that belong to the top 20%.
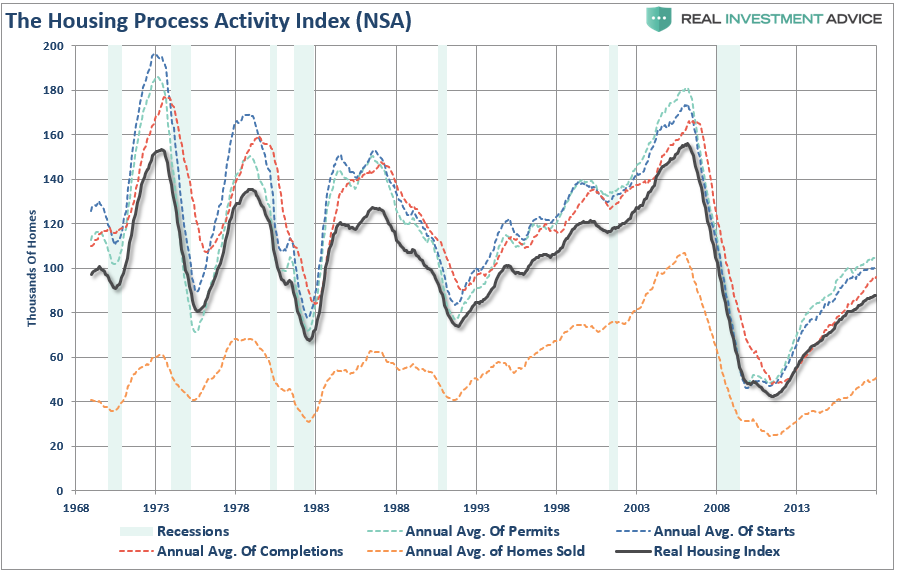
Furthermore, there continues to be far more houses in the “process” stage (permits, starts and completions) than actual homes being sold.
This activity at “the margin” is further obfuscated by the seasonal adjustment, and annualization, of the data in the monthly reports. However, by analyzing the Census Bureau data of how many homes are sitting vacant, owner-occupied or being rented, we can obtain a much clearer picture of the real strength of the housing market and the purported recovery.
Vacancy Rate
Out of the total number of housing units, some are vacant for a variety of reasons. They are second homes for some people that are only used occasionally. They are being held off-market for one reason or another (foreclosure, short sell, etc.), or they are for sale or rent. The chart below shows the total number of homes, as a percentage of the total number of housing units which are currently vacant.
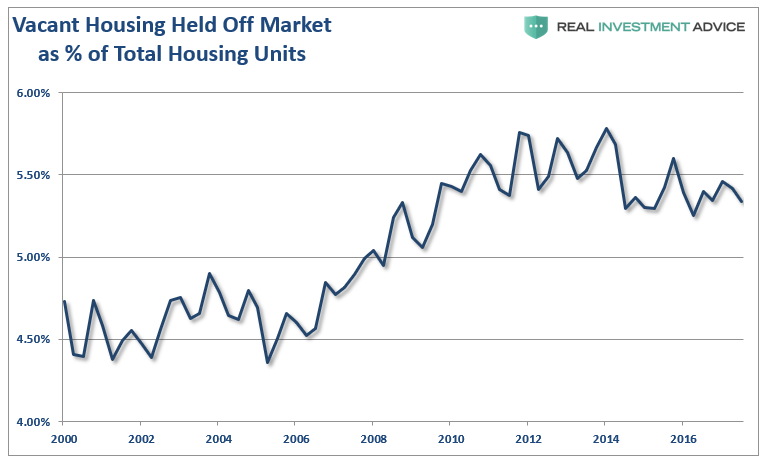
If a real housing recovery were underway, the vacancy rate would be falling sharply rather than hovering only 0.5% below its all-time peak levels.
Owner Occupied Housing
Another sign that a “real” housing recovery was underway would be an increase in actual home-ownership. The chart below shows the number of owner-occupied houses as a percentage of the total number of housing units available. See the problem here?

There are two important points here.
The first is the recent uptick in “occupied” housing doesn’t equate with the reported rise in home sales shown above.
Secondly, while owner-occupied housing as finally ticked up, it coincides with the recent jump in interest rates which is likely forcing buyers into the market temporarily. However, since rates have everything to do with “payments,” the bounce is likely ephemeral if rates do indeed rise further.
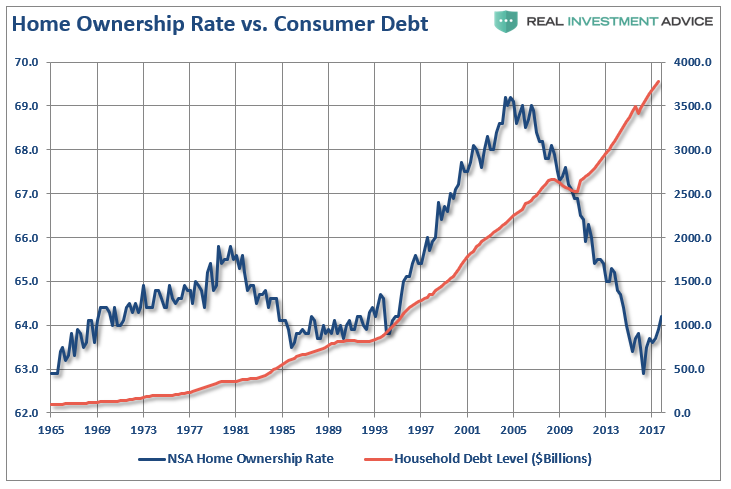
Home Ownership
The reality is that there has been little recovery in housing. With nine years of economic recovery now in the rearview mirror, it is clear that the average American is not recovering as evidenced by the lowest level of home ownership since the 1980’s. The recent uptick, as stated above, coincides with a sharp acceleration in debt as interest rates have begun to pressure buyers.
However, the recent reports of sales, starts, permits, and completions have all certainly improved in recent months. Those transactions must be showing up somewhere, right?
Buy To Rent
As John notes, prices are rapidly rising in the “hotbed” areas. As the “Buy-to-Rent” game drives prices of homes higher, it reduces inventory and increases rental rates. This in turn prices out “first-time home buyers” who would become longer-term homeowners, hence the low rates of homeownership rates noted above. The chart below shows the number of homes that are renter-occupied versus the seasonally adjusted homeownership rate.

Speculators have flooded the market with a majority of the properties being paid for in cash and then turned into rentals. This activity drives the prices of homes higher, reduces inventory and increases rental rates which prices “first-time homebuyers” out of the market.
The recent rise in the home-ownership rate, and subsequent decline in renter-occupied housing, may an early sign of rental investors, aka hedge funds, beginning to exit the market. If rates rise further, raising borrowing costs, there could be a “rush for the exits” as the herd of speculative buyers turn into mass sellers. If there isn’t a large enough pool of qualified buyers to absorb the inventory, there will be a sharp reversion in prices.
There is no argument that housing has indeed improved from the depths of the housing crash in 2010. However, that recovery still remains at very weak historical levels and the majority of drivers used to get it this point have begun to fade. Furthermore, and most importantly, much of the recent analysis assumes this has been a natural, and organic, recovery. Nothing could be further from the truth as analysts have somehow forgotten the trillions of dollars, and regulatory support, infused to generate that recovery. More importantly, homebuilder sentiment has gone well beyond the actual level of activity.
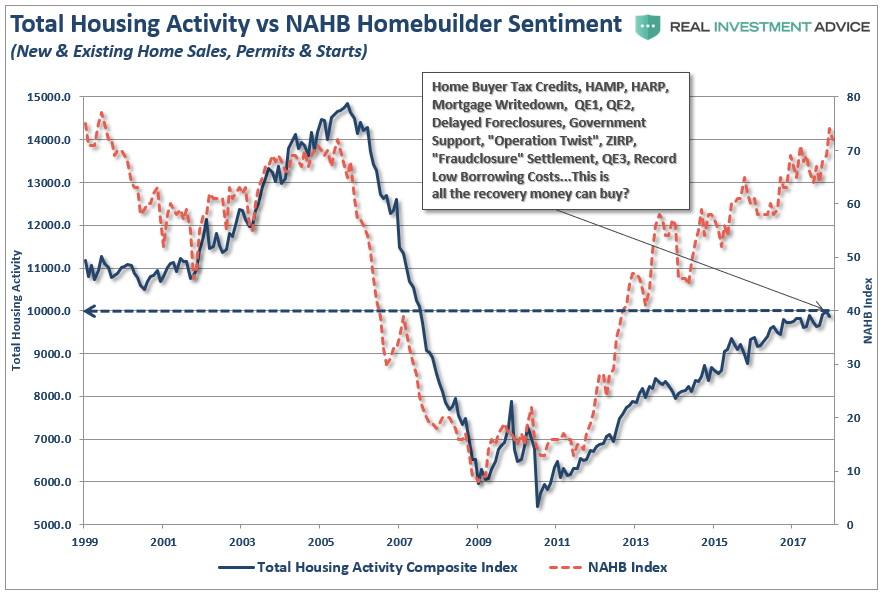
The point here is that while the housing market has recovered – the media should be asking ‘Is that all the recovery there is?’
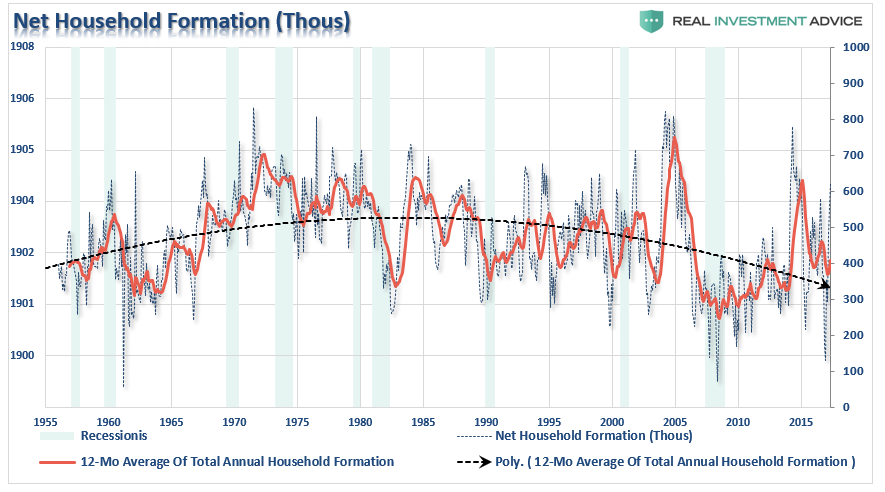
The housing recovery is ultimately a story of the “real” unemployment situation that still shows that roughly a quarter of the home buying cohort are unemployed and living at home with their parents. The remaining members of the home buying, household formation, contingent are employed but at lower ends of the pay scale and are choosing to rent due to budgetary considerations. This explains why the 12-month moving average of household formation, used to smooth very volatile data, is near its lowest levels going back to 1955.
While the “official” unemployment rate suggests that the U.S. is at full employment, the roughly 94-million individuals sitting outside the labor force would likely disagree. Furthermore, considering that those individuals make up roughly 50% of the 16-54 aged members of the workforce, it is no wonder that they are being pushed to rent due to budgetary considerations and an inability to qualify for a mortgage.
The risk to the housing recovery story remains in the Fed’s ability to continue to keep interest rates suppressed. As stated above, individuals “buy payments” rather than houses, so each tick higher in mortgage rates reduces someone’s ability to meet the monthly mortgage payment. With wages remain suppressed, and a large number of individuals either not working or on Federal subsidies, the pool of potential buyers remains contained.
The real crisis is NOT a lack of homes for people to buy, just the lack wage growth to be able to afford to. Of course, that probably says more about the “real economy” than just about anything else.
Lance Roberts

Lance Roberts is a Chief Portfolio Strategist/Economist for Clarity Financial. He is also the host of “The Lance Roberts Show” and Chief Editor of the “Real Investment Advice” website and author of “Real Investment Daily” blog and “Real Investment Report“. Follow Lance on Facebook, Twitter and Linked-In