Not as strong as many, including President Trump believes…

GDP growth and even the jobs data, including the unemployment rate, though fairly sunny, look deceptively strong and need a deeper look, which we have provided for you over the past few weeks. See here.
How Will The Economy Hold Up As Trade War Escalates?
More important, is the U.S. economy so strong it can withstand an escalation in the trade war with China?
We seriously doubt it and fully expect Trump will be forced to cave on some of his completely unrealistic demands. We have been consistent from day one: China will never give up its sovereignty by changing the structure of its economy.
Seriously, folks, do you really think the Middle Kingdom, with all its history and past glory, after climbing back to global superpower status, is now going to cave and give up some of its sovereignty because Trump demands it?
President Xi already seems to be preparing his population for the worst case scenario, warning of “challenging times ahead” possibly in the event Trump goes ahead with the tariff hikes. Maybe we are reading too much into it and maybe not. – GMM, Feb 12th
So much for the “Art of Deal.” Greed kills.
Trump and his hardliners don’t seem or care to understand Chinese culture and the concept of shi miàn zi (面子),” or losing face. Xi can’t back down now and if Trump takes the next step in the trade war, China will be forced to match tit-for-tat, lest the country’s leadership looks weak and loses face.
We still believe there will be a “deal”, though one with little gain that has already caused lots of pain. Potemkin and toothless, just as NAFTA 2.0 and KORUS, but will be sold as the “greatest deal ever made.”
GDP Growth Distorted In Q1
We unpacked the 3.2 percent Q1 GDP post and found it much weaker than the headline number conveyed.
The number was much weaker than it appeared.
Private domestic demand (also known as real final sales to private domestic purchasers) –personal consumption + nonresidential and residential fixed investment – which is the traditional driver of robust and sustained economic growth contributed less than 35 percent to Friday’s headline growth number. This was the lowest proportional level since Q4 2009.
The bulk of GDP growth came from the combination of a big inventory build, net exports, and government spending (see table below).
…we ran the numbers and found that 5 of the 15 quarters after such similar aberrational 3 percent plus growth as was the case in Q1 2019, where private domestic demand’s contribution was so small, experienced negative growth. Only 3 of the 15 quarters did economic growth accelerate.
The average growth deceleration of this sample was 435 bps quarter on quarter. — GMM, April 28th
The Atlanta Fed’s Q2 GDP Now forecast, which was spot on early in Q1 that growth was much stronger than what the market socialists, who were calling for an emergency Fed rate cut to bail out the stock market, were forecasting and panicking over.
The GDP Now latest forecast has Q2 coming in around 1-1.5 percent but we believe this was posted before the latest escalation in the trade war.
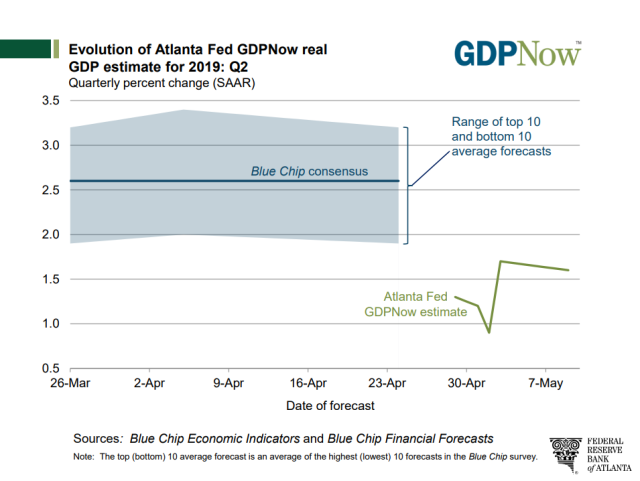
The increased stock market volatility, coupled with the huge spike in economic uncertainty caused by the ratcheting up of tensions, will almost certainly depress consumer and capital spending even more and likely shave several bps off Q2 growth. We wouldn’t be surprised to see the Blue Chip consensus forecast, which is now over 2.5 percent for Q2, cut in half in the next month, and the probability of the actual number coming in less than 1 percent, is increasing by the day.
Not such a strong economy, in our book.
Maybe the Chinese negotiators get it and the Trump team has yet to receive the memo.
Labor Market: Employment and Unemployment Rate
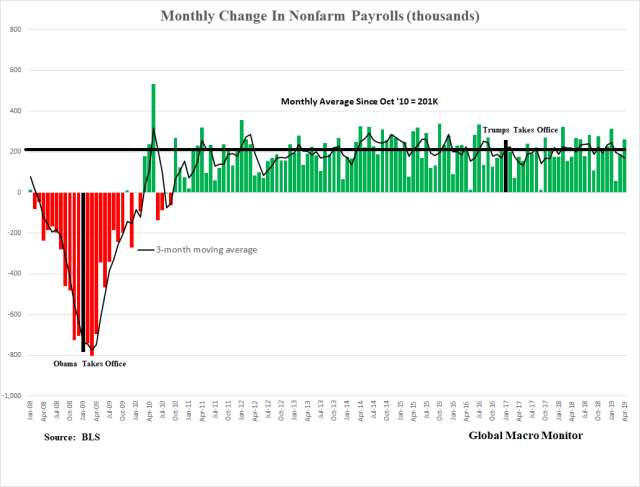
The labor or jobs market is still humming along in the nonfarm sector, almost exactly as it has been since October 2010, when labor market fully recovered. The monthly increase in nonfarm payrolls in 2019 is averaging 205k, just a smidgen above 201k monthly average since the positive streak began in October 2010.
Strong and decent growth, neither showing a sustained acceleration or deceleration. The strongest jobs market ever? You decide.
Wages
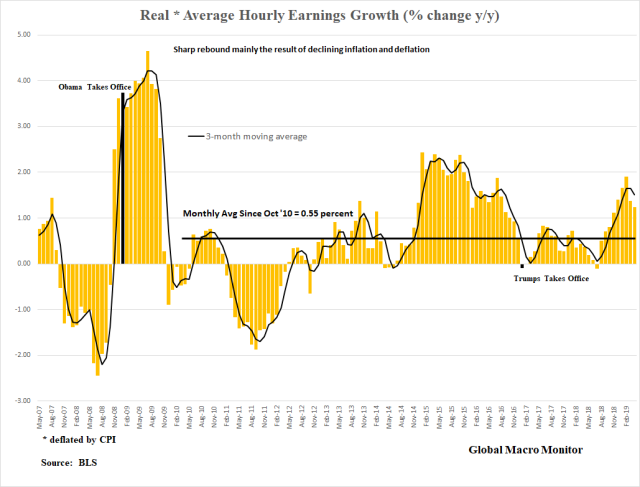
Nonfarm real wages have picked up in the past year, growing much faster than the monthly year-on-year average of 0.5 percent since the jobs market recovered in October 2010. Even still, as the chart illustrates, nothing that spectacular.
Trouble In the Farm Belt
We noted in our recent post, Nonfarm Payrolls & Employment Data Diverging, the employment data, gathered by a different survey, which includes the farm sector, self-employed, and informal labor market, and doesn’t double count jobs, is weakening in 2019.

It is not certain the divergence is noise or reflects a significant weakening in other sectors not picked up in the payrolls survey and hitting the economy much harder than the market believes. We encourage you to read the post.
Unemployment Rate (UR)
In the same post, we went deeper into the unemployment rate that hit a 50-year low in April. We found that the employment-population ratio was only 60.6 percent compared to the April 2000 high of 64.7 percent when the UR was at 3.8 percent.
We tried to explain the differential through demographics but still found that the percentage of the employed working-age population is lower than it was before the last recession. Our conclusion was the UR is distorted by the vagaries of measuring and participation in the labor force, and unemployment itself.
Working Age Population Not In The Labor Force
We also discovered the working-age population (16-64 years) not in the labor force remains higher than it was before the recession, making it impossible to get a true comparative measure of unemployment across time. We suspect the UR would be several basis points (bps) higher if this measure was accounted for. To say the “unemployment rate is at a 50-year low” needs some qualification, to say the least.
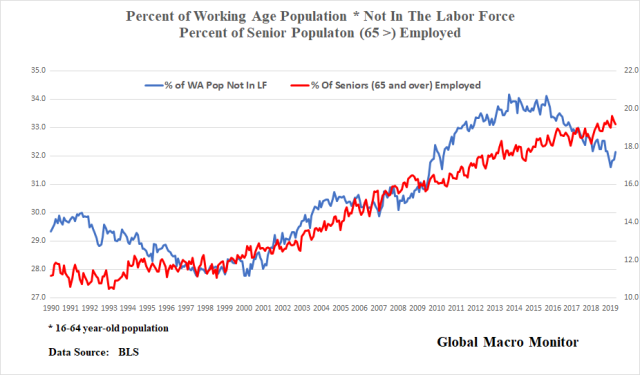
Moreover, the number of employed seniors (65 years >) has grown by over 70 percent before the recession started with almost 20 percent of the cohort group now employed compared to around 10 percent in the 1990s. Some of which is due to the pure demographics of an aging population but much of which is probably the result of a lack of adequate retirement savings, which is not exactly a sign of strength, in our opinion.
Upshot
If you have been following the GMM for any length of time, you know we love being a contrarian voice. taking on and challenging the conventional wisdom of the markets. We only touched on a few of the headline indicators and if we had time would go deeper into debt, capital spending and many of the other macro indicators. You don’t pay us enough, however.
Nevertheless, if and when the dark thunderstorm clouds arrive, you can’t say you were not warned.
Go deeper and sharpen your pencils, folks.