The following post was based on an excerpt from a recent report published in The Felder Report PRO.
Warren Buffett recently said wrote, “Prices are sky-high for businesses possessing decent long-term prospects.” And I wouldn’t be surprised if he was looking at the whole of Corporate America when he wrote it. According to his own measure, stocks are just as highly-valued today as they were near the peak of the dotcom mania. The chart below plots the total value of U.S. equities to the total size of the U.S. economy. In December of 2001, Mr. Buffett wrote of it, “it is probably the best single measure of where valuations stand at any given moment.”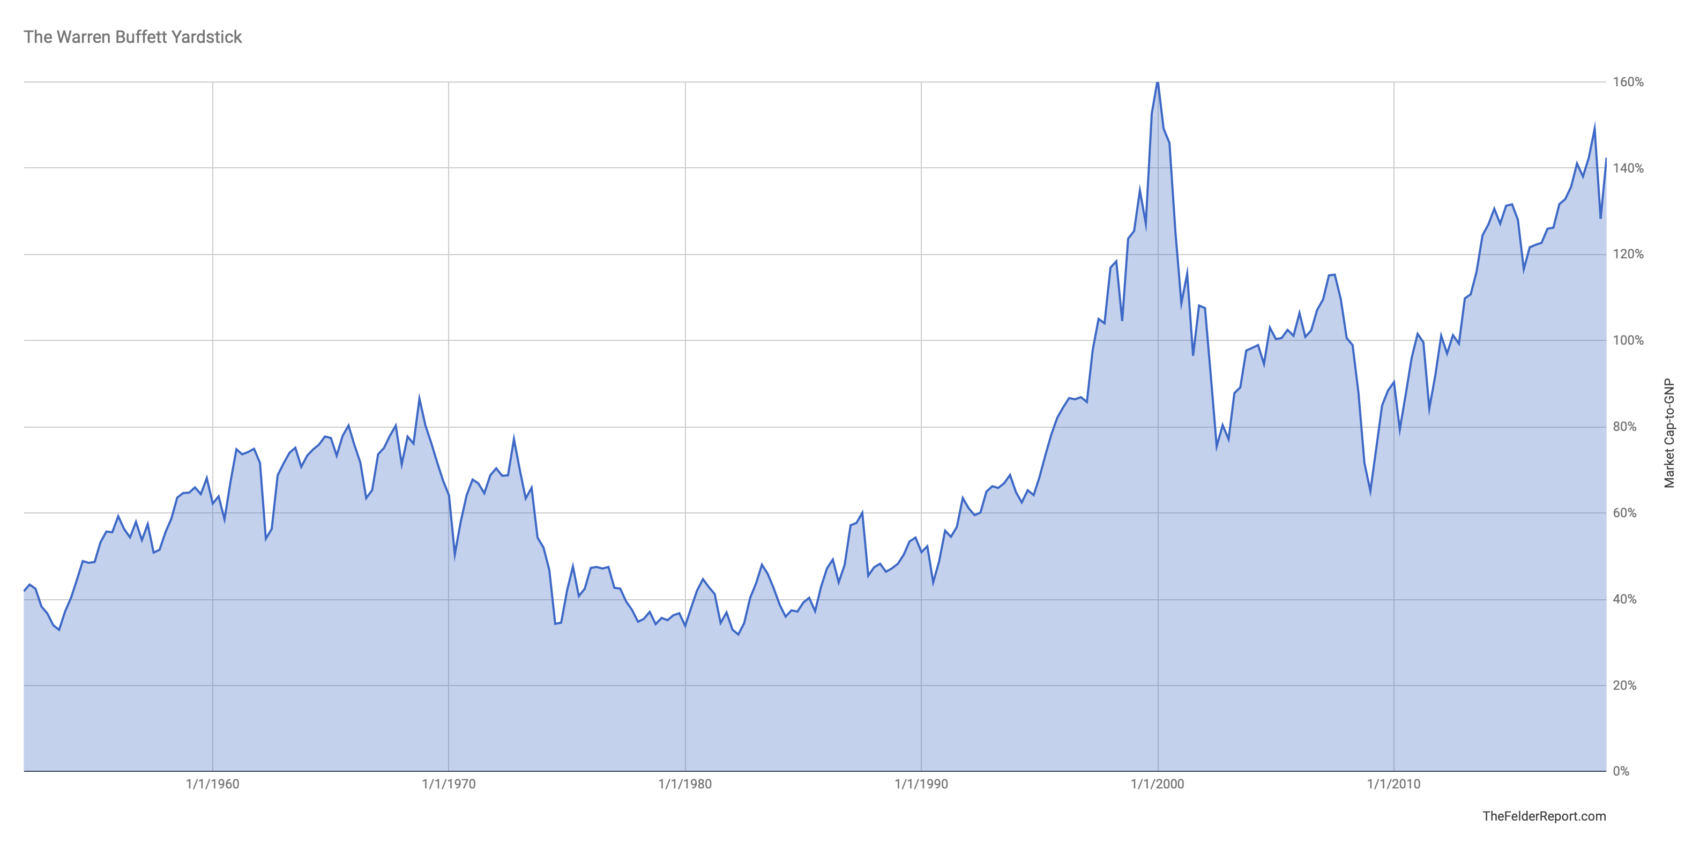 What really makes this measure so valuable is that it is very good at telling you what your returns will likely be over the coming decade. As Mr. Buffett has famously said, “the price you pay determines your rate of return.” Pay a cheap price, like investors were able to do back in the early 1980’s, and you will get a fabulous return. Conversely, if you pay a steep price, as investors did 20 years ago, you will get a very poor annualized return over the coming decade. Currently, this measure suggests equity investors will like receive something in the neighborhood of negative 2% per year, including dividends, over the coming decade.
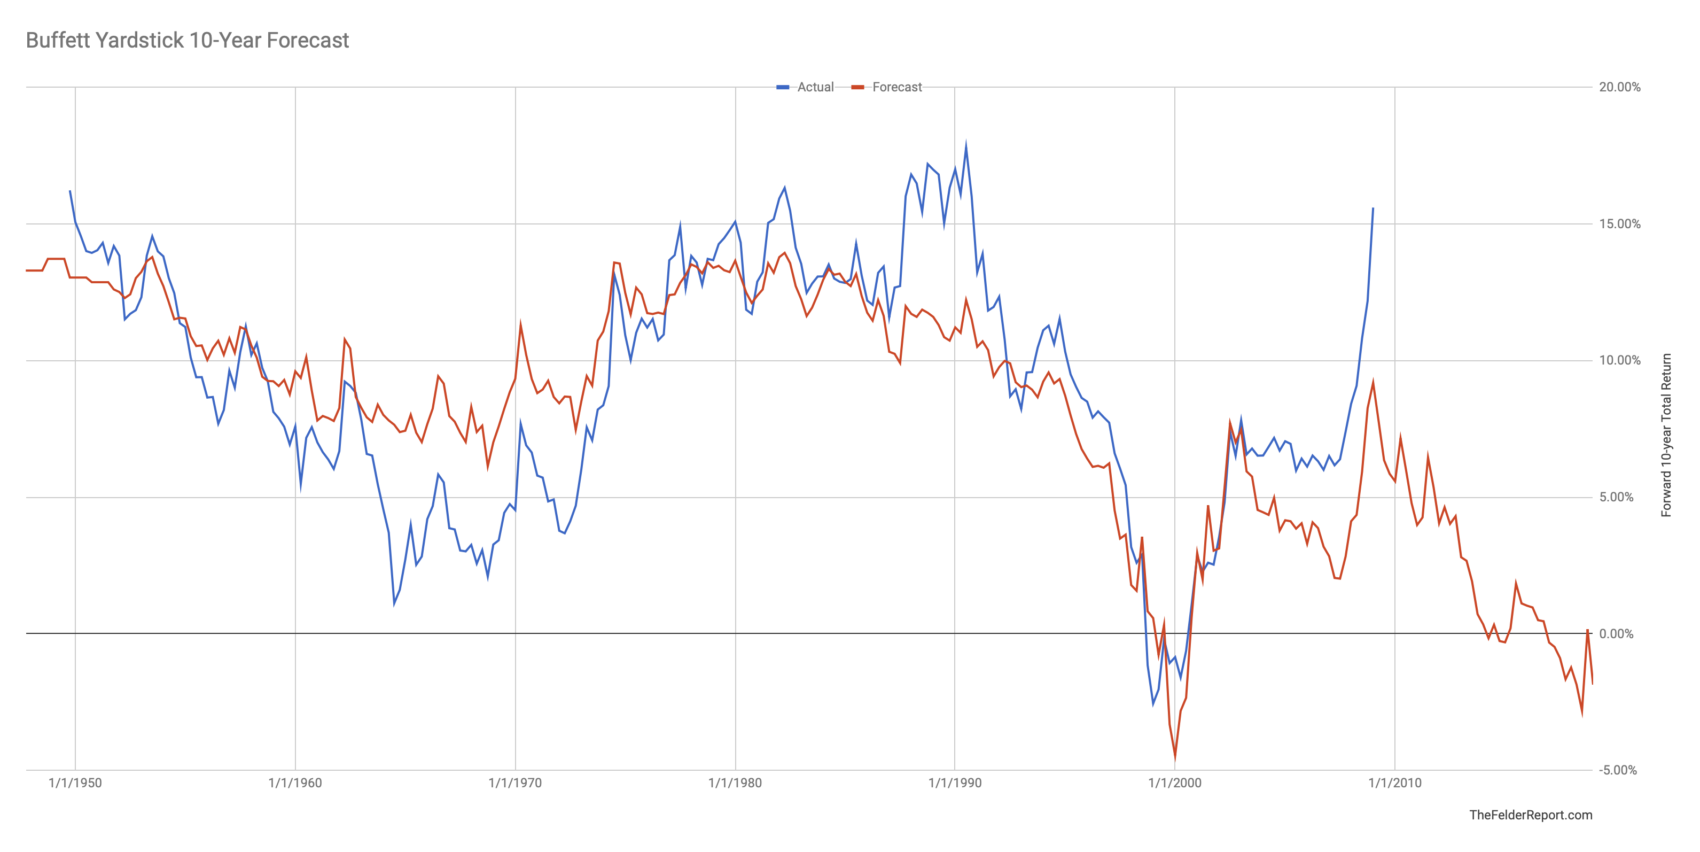
What should really jump out at you, however, when looking at the chart above is the dramatic difference between forecast returns (red line) and actual returns (blue line) over the past decade. To my way of thinking this is simply the difference between the amount of return justified by the fundamentals and the amount of excess return driven by investor euphoria. Notice the last time this happened was at the peak of the dotcom mania. The chart below plots the difference between actual and forecast returns alongside the Michigan Consumer Sentiment index. It’s pretty clear to see that excess returns can almost entirely be explained by optimistic sentiment (ht @NoBServations).
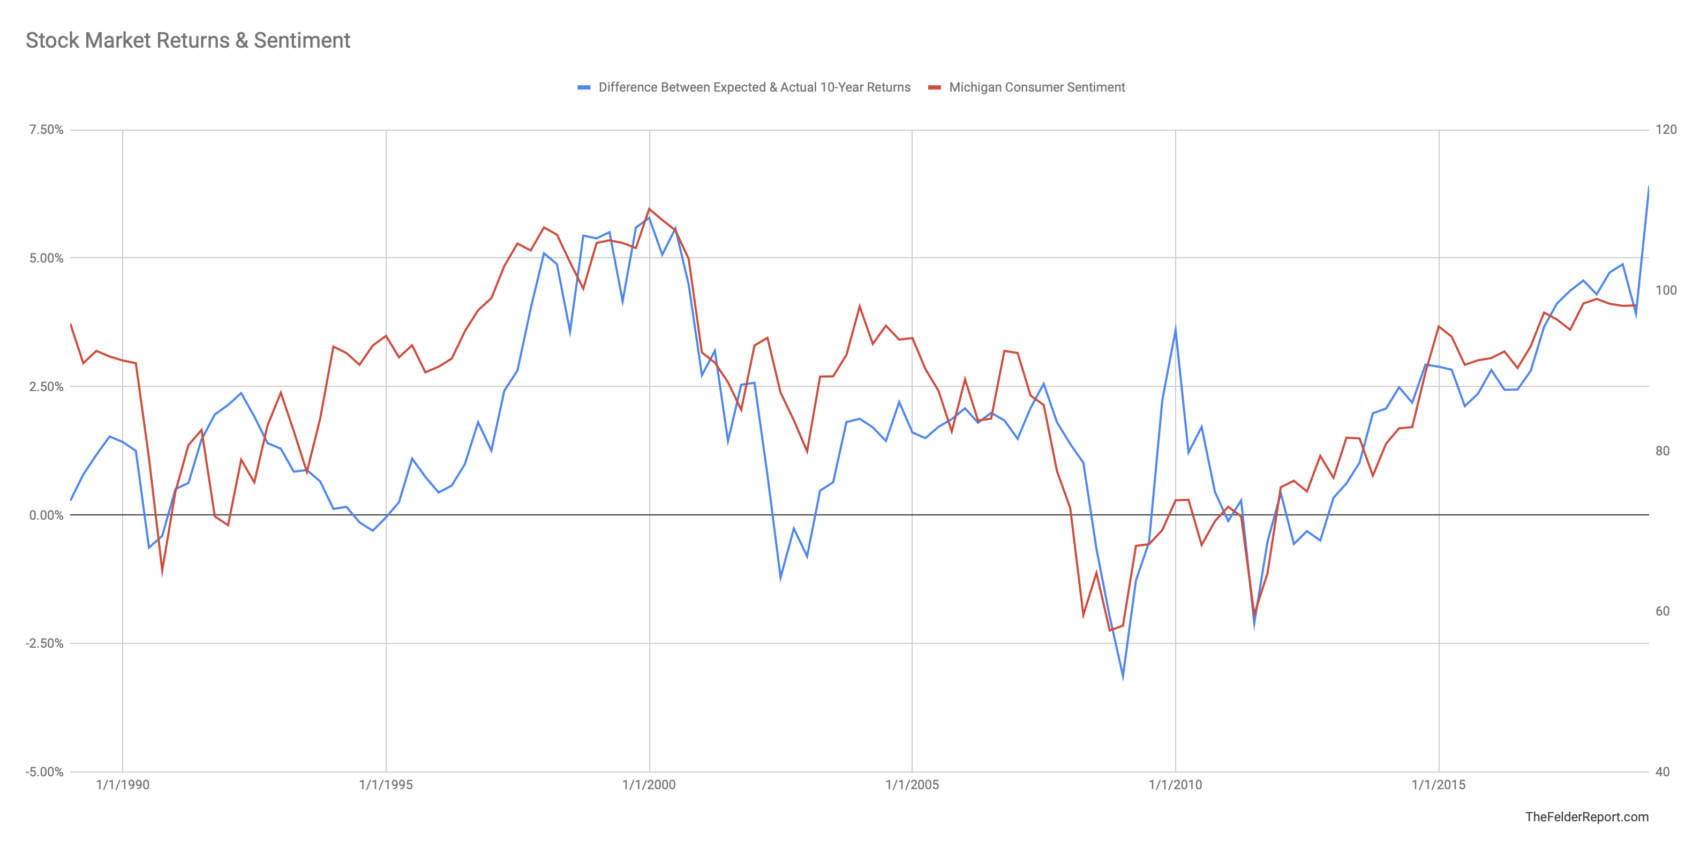 It’s also pretty clear to see that the current spread of realized returns above forecast returns is even higher today than it was at the peak of the dotcom mania. There may be no better visual representation of the sort of euphoria that can accrue as a direct result of the longest (and least volatile) bull market in history. Equity investors better hope this sentiment extreme can sustain itself indefinitely. Because a reversion in sentiment likely means a reversion in valutions, a reversion at least on par with that seen after the last time both valuations and euphoria reached their present extremes.