Wolf Richter wolfstreet.com, http://www.amazon.com/author/wolfrichter
Fueled by cheap money and by dashed hopes of high oil prices.
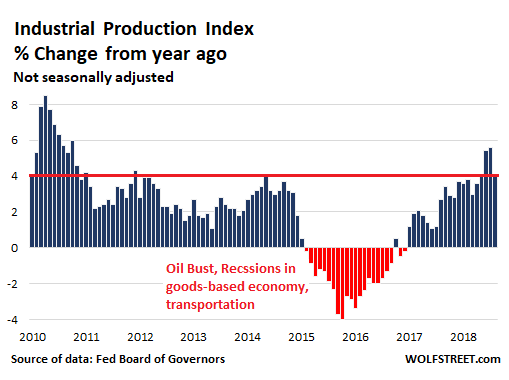
Industrial production in October rose 4.1% from a year ago, the Fed Board of Governors reported this morning. This was in the upper portion of the range since 2010. It was powered in part by the blistering oil & gas production boom that followed the Oil Bust of 2015 and 2016.
This chart shows the percent change in industrial production from the same month a year earlier. The red bars – industrial production falling year-over-year – coincide with the recession in the goods-based economy, the transportation recession, and the Oil Bust:
As part of the overall index, manufacturing rose 2.7% from a year ago, utilities 1.7%, and mining, which includes oil & gas extraction, jumped 13.1%. Oil & gas extraction on its own soared 16.5% from a year ago.
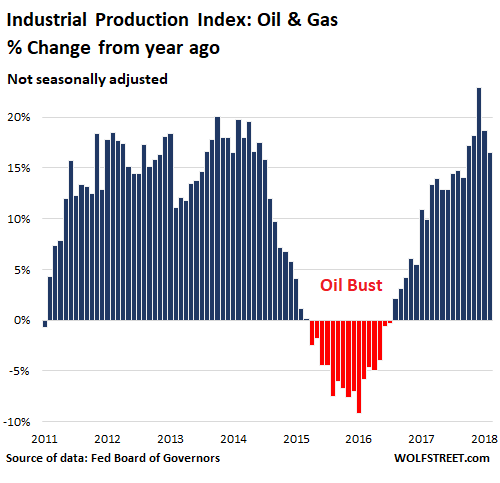
On a monthly basis oil & gas extraction edged down a smidgen over the past two months from a spikey record in August, when it had soared 22.9% year-over-year.
The chart below shows the Industrial Production sub-index for crude oil and natural gas extraction. Note the brief effects of Hurricane Katrina when production along the Gulf Coast was shut down, the Financial Crisis when everything came to a standstill, the subsequent fracking boom, the oil bust in 2015 and 2016, and then the renewed boom. Since the trough of the oil bust in September 2016, the index has surged 31.5%:
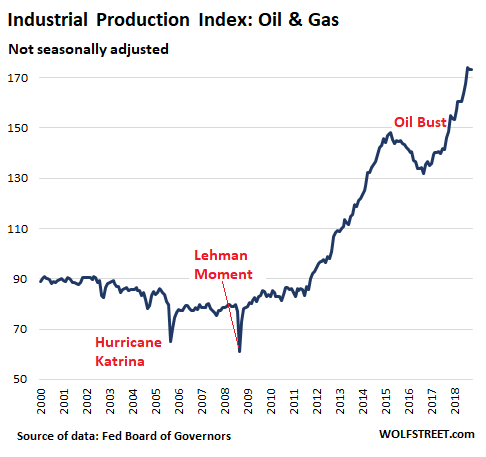
It has been a wild ride in the oil & gas sector. At the end of 2008 – following the Lehman Moment – everything came to a halt for a couple of months, but then activity rebounded. Starting in 2011, the fracking boom, fueled by waves of new money trying to find a place to go, took off. At the time, oil prices (WTI) ranged from $75 to $113 a barrel. But in July 2014, oil prices began to dive, and in 2015, the oil bust hit production. At the end of 2016, the oil and gas boom took off again. This chart shows the year-over-year percentage change. Note the 22.9% spike in August:
The oil and gas boom is economically important not only in the oil patch but in the broader US economy, with high-paying jobs in the oil field, transportation, manufacturing, specialized services, and high-tech. An oil boom requires equipment of all kinds; it fires up manufacturing; pipelines have to be built; all this equipment has to be transported, triggering a transportation boom, and the like. It usually leads to a construction boom as well, with all the secondary effects.
The US has been the largest natural gas producer in the world for several years. In August 2018, at least for that month, the US became the largest crude oil producer in the world. For better or worse, this sector has become a powerful player in the US economy. It’s fueled by cheap money and by hopes of high oil prices. Alas, the cheap money is evaporating, and hopes of high oil prices have taken a serious beating in November. Boom and bust, always. Hence the old rule in the business: Never drill with your own money.