My discovering that the pathology used to categorize hurricane risk (Categories 1-5) can also be utilized for stock market crashes is a breakthrough for all investors. Instead of riding out crashes, as was similarly the case for hurricanes, investors now and in the future, will know when to get out!
The violent market correction which began on February 20, 2020, is the third Category 5 crash to occur over the past 100 years. For various reasons (read my “Crash of 2020” articles) and not the Coronavirus, the Crash of 2020 has the potential to be the most destructive of all previous Category 5s.
According to the pathology of Category 5 crashes the probably is 100% that the stock indices of the US, Canada, Germany and Japan will decline by a minimum of 77% from their 2020 highs. The bottoms for all of the indices will be reached in fourth quarter of 2022.
It is my strong opinion that all stocks above $10, mutual funds and ETFs in the US, Japan and Canada be liquidated when the market opens on Thursday March 12, 2020. This assumes that the indices open at or above their pathologies’ 23% interim rally thresholds. Please read entire article and review thresholds tables below.
Hurricane forecasting became possible after airplanes were able to fly into storms to obtain their barometric pressure. The more than 100 years of historical market data can be utilized to identify repeated patterns of extreme fear and greed which occur at market tops and bottoms.
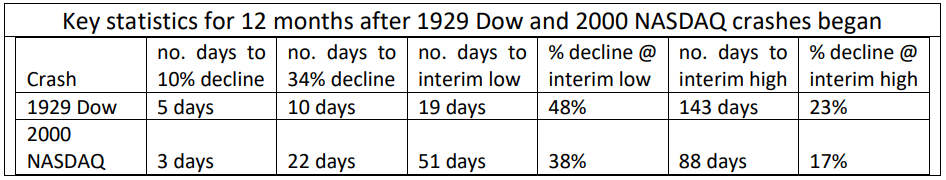
Since February 20th the pathology for the crash of 2020, has been very similar to the pathology for the two previous Category 5’s which occurred over the past 100 years, the Crash of 1929 and the bursting of the Nasdaq dotcom bubble in 2000. The pathologies, durations and percentage declines, etc., for the 1929 and 2000 CAT 5s were almost identical.
The Dow Jones index during the crash of 1929 declined by 89% and bottomed in 1932 after 32 months. The decline for the Nasdaq from 2000 to 2002, lasted 31 months and its decline was 78%. The two rank at 1 and 2 for crashes having the highest percentage declines over the past 100 years. None of the other significant corrections and mini crashes that have occurred since 2000 were a Category 5 (“CAT 5”). This includes the crashes of 2008 and 2018.
Extensive prior research of crashes enabled me to develop algorithms to predict them. My postmortem on Enron after its spectacular flameout, led to my discovering a flaw in its financials that could have been utilized to predict its bankruptcy. The resulting algorithm was utilized to predict the demises of Lehman, Bear Stearns and Merrill Lynch in a 2007 magazine article. My research on the February 2016 mini-crash after the Bank of Japan instituted negative interest rates, led to an algorithm which predicted the 2016 Brexit and October 2018 crashes. The algorithm was converted into the trend trading Bull & Bear Tracker. Click here to read about my algorithms.
The data and statistics from the 1929 and 2000 CAT 5 crashes in the table below has been utilized to forecast the pathology for the 2020 crash. The pathologies for the 1929 and 2000 crashes will be especially useful to those who did not get out at or above 2020 CAT 5 Crash’s 23% interim relief rally threshold.

The linear progression of the pathology and statistical probabilities for a Category 5 crash’s six key thresholds are contained in the table below.

This table below contains the 2020 CAT 5 Crash’s interim rally 17% and 23% thresholds which investors can utilize to exit the markets before the indices crash through them and towards the 34% correction threshold.

Its urgent that investors exit the markets before the indices in the table below decline by more than 23% from their 2020 all-time highs. This would enable investors to avoid the stress and anxiety from having to wait 88 (6/5/20) to 143 (8/25/20) days for the interim low to be made and for the interim rally to occur before the indices in above table can get back to within 23% of their all-time highs.
Based on the statistics in the statistical probabilities table after the 34% correction from the 2020 highs has occurred the probability is 100% that the indices will further decline to their interim bottoms which will be at a minimum of 38% below their 2020 highs.
After the interim bottom has been established the probability is 100% that the indices will mount powerful rallies that will get them back to within 23% of their 2020 highs. After the rallies have occurred the probability is 100% that they will resume their declines.
On the February 20, 2021, first anniversary of their corrections beginning, the probability is 100% that the indices will have declined by a minimum of 52.4% from their 2020 highs. The declines for the 1929 and 2000 crashes on their first anniversaries were 52.4% and 62.2% respectively.
My prediction is that the S&P 500’s secular bull market which began in March 2009 ended on February 19, 2020. The ninth secular bear since 1802 began on February 20th. Based on the peaks of the last three secular bull markets as compared to the troughs of the of the three most recent secular bears, the S&P 500 could decline by an additional 47% to 80% from its March 6, 2020 close.

The video of my “Secular Bulls & Bears: Each requires different investing strategies” workshop at the February 2020 Orlando Money Show is highly recommended. The educational video explains secular bulls and bears and includes strategies to protect assets during secular bear markets and recessions, etc.
BullsNBears.com which covers all of the emerging and declining economic and market trends is an excellent resource site. Click here to view one-minute video about the site and here for my 2020 crash updates.
A strategy to liquidate all mutual fund holdings and the majority of all stock holdings should be deployed immediately. Time is of the essence. To understand why diversification does not work and why penny and low-priced stocks should be held watch Money Show workshop video.
To maximize liquidation amounts assuming that one did not exit at above the key 2020 crash pathology levels, an investment advisor (RIA) who has been vetted by BullsNBears.com should be utilized. The advisor must have the expertise to technically trade the market so that higher liquidation prices can be obtained.
Additionally, since any referred RIA will be able to utilize the Bull & Bear Tracker’s signals to manage a portion of a portfolio, losses could quickly be recouped. It’s because the Bull & Bear Tracker thrives on volatility to produce significant profits in declining and in volatile markets. See March 6, 2020 article “February 2020, Bull & Bear Tracker’s 8th consecutive profitable month”.
