via upfina:
The September CoreLogic Case-Shiller index wasn’t terrible, which is encouraging since many housing related indexes have shown weakness recently. The problem with this report is it’s from September. Therefore, it doesn’t quell investors’ nerves about the direction of the housing market which is caused by more recent weakness. On a seasonally adjusted basis, 20 city month over month price growth was up from 0.1% to 0.3% which matched estimates.
Non-seasonally adjusted growth was flat which matched August. Year over year, non-seasonally adjusted growth was 5.1% which fell from 5.5% and missed estimates for 5.3%. Keep in mind, housing will become less of a boost to inflation in the next few reports. This report includes data already seen in inflation metrics.
It’s no surprise Las Vegas had strong appreciation and New York did poorly. These trends have been ongoing for a few quarters. The fastest monthly gains of 0.9% were in Las Vegas and Phoenix. The Las Vegas suburbs might be in a bubble as prices are soaring. Seattle and San Diego have seen contraction for 3 months. Seattle had been one of the hottest markets this cycle, but it has been cooling recently. Las Vegas had the best yearly appreciation as it increased 13.5%. Second was San Francisco at 10%. Seattle was up 8.4% which isn’t great compared to recent rates. It grew at 13.6% in May 2018. The weakest cities were New York and Washington D.C. which grew only 2.7% and 2.9%.
FHFA Home Price Index
The FHFA housing price data is also from September. This report wasn’t great as month over month prices increased 0.2% which is down from 0.4% and missed estimates for 0.3%. Yearly growth was 6% which fell from 6.3%. The Mountain region had the best appreciation as it increased 1.3% monthly and 9.5% yearly. The Pacific was brought down by Seattle as prices fell 1.1% monthly and rose 5.5% yearly. Finally, the Middle Atlantic was the worst as it was brought down by NYC and Washington D.C. Yearly price growth was 4.1% and monthly growth was 0.4%.
Quick Housing Summary
The chart below packs a ton of housing data.
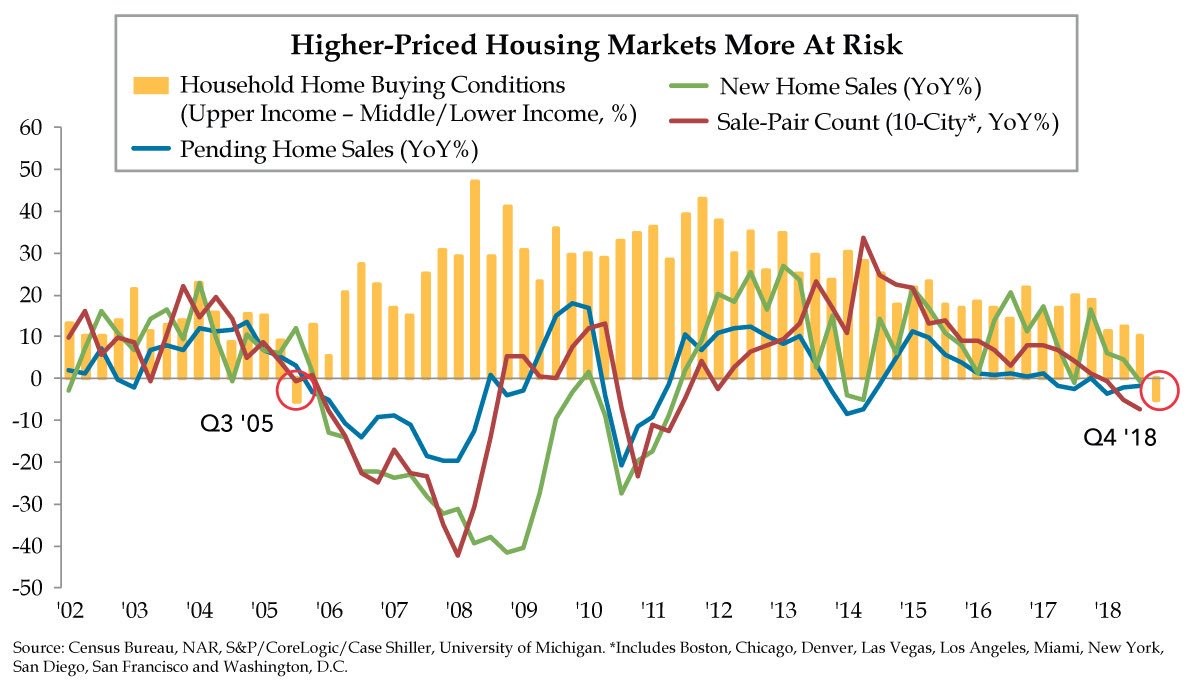
Source: National Association of Realtors
Home buying conditions are negative like in Q3 2005. Higher priced homes are more at risk of falling. New home sales, pending home sales, and the sale pair count are all weakening. The sale pair count tracks the changes in home prices between sales. There needs to be 2 sales for the data to be calculated.
Housing Industry
Lately, it looks like housing stocks may have bottomed in the near term because so much bad news has already been priced in. Since October 24th, the ITB housing ETF is up 7.66%. However, it still has had a terrible year. As you can see from the table below, homebuilders have been leading indicators of peaks in the S&P 500. It’s not just the last cycle which was driven by the collapse in housing. In the past 5 cycles, homebuilders have led the stock market 4 times.
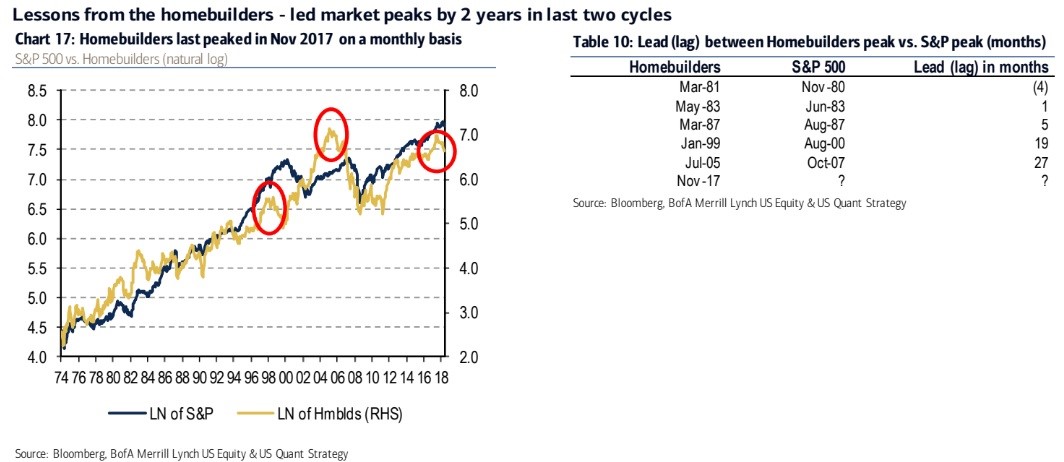
Source: Merrill Lynch
If you average the past 5 cycles, housing leads the stock market by 9.6 months. The table shows homebuilders peaked on November 2017. The S&P 500 may have peaked in September. That works out well if the September peak is the final cycle peak, but that’s far from a certainty. The ITB ETF of housing stocks peaked in January 2018. It’s worth mentioning if the tariffs are undone, housing stocks may do well because of lower costs. However, the metals tariffs are locked in for some areas, so it may not be a big help for these stocks. Also, metals prices have been falling anyway. The far more important variables for these stocks are the health of the consumer and the labor market.
Consumer Confidence Falls Slightly
The November Conference Board consumer confidence index was 135.7 which missed estimates for 136.5 and the prior reading of 137.9. This is the most important reading of the year since it’s the holiday shopping season. The difference between the present situation index and the expectations index is a great metric to predict recessions. The gap widened as the present situation index increased 0.8 to 172.7 and the expectations index fell 4.1 points to 111. That’s bad news.
The ‘jobs plentiful’ index increased 1.2% to 46.6%. The present situation’s ‘jobs hard to get’ calculation fell 1.2% to 12.2%. The chart below shows the historical difference between the 2 calculations.
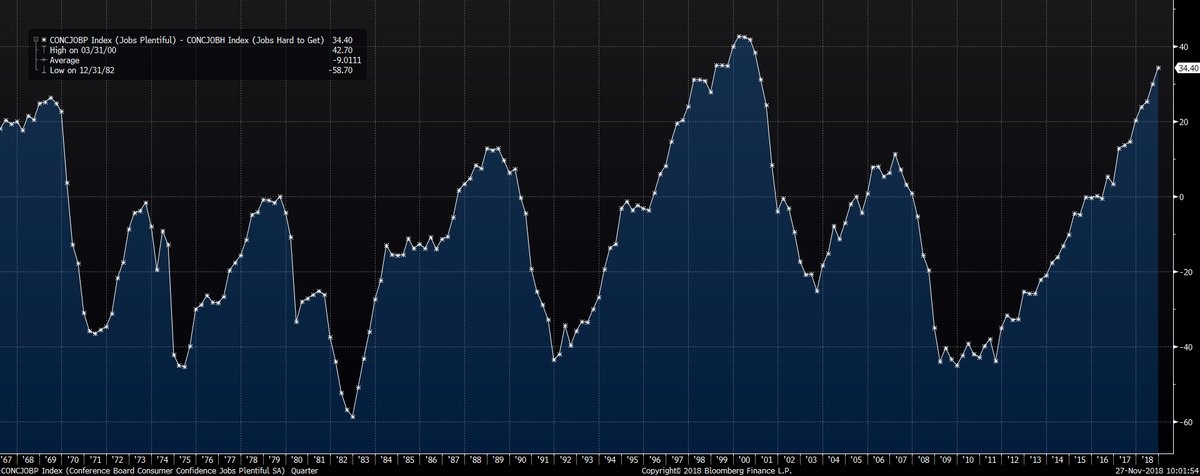
Source: Bloomberg
This is one of the best labor markets ever as only the readings in 2000 were higher. The bad news is the peak will likely come soon. The good news is it usually peaks a few quarters before recessions. If it peaks in 2019, there might not be a recession until 2020.
The chart below pairs the recent survey data with the unemployment rate to gauge the survey’s accuracy.
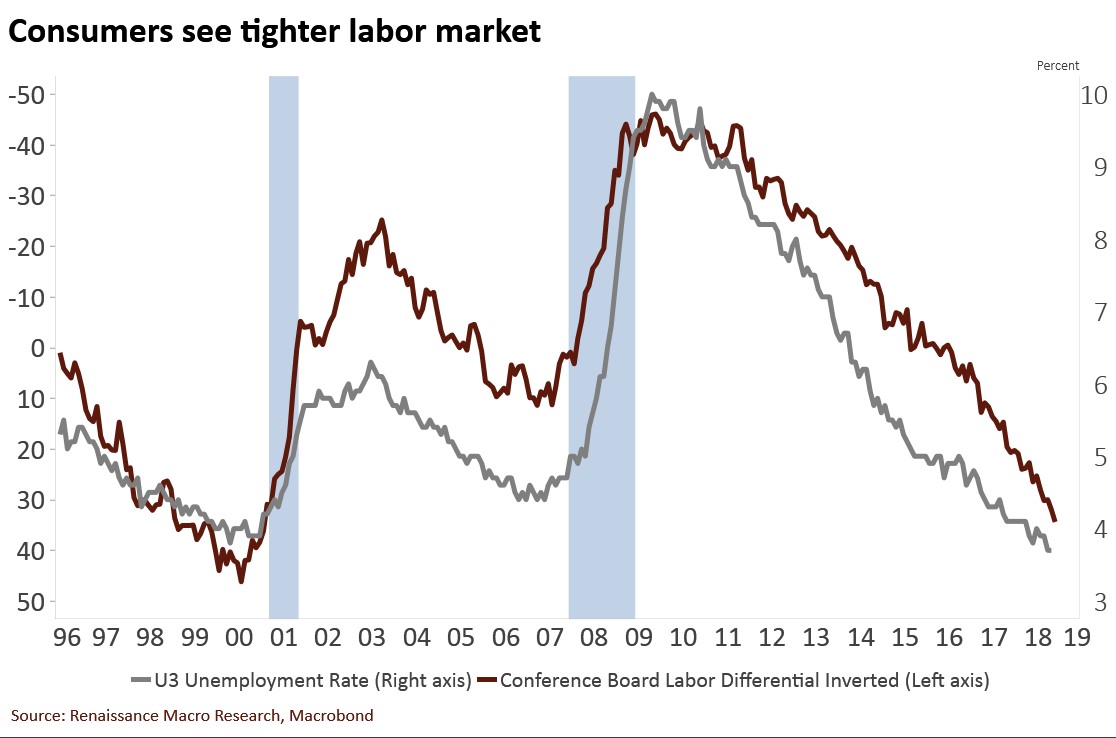
Source: Renaissance Macro Research
In relation to the unemployment rate, the survey is relatively pessimistic as this index is above the unemployment rate. It was optimistic in the late 1990s and even more pessimistic in the 2000s.
Let’s look at the rest of the details of this report. The percentage of stock market bulls fell from 43.6% to 35%. That’s a good thing as it means more bears can be converted to bulls. Inflation estimates increased 0.1% to 4.9% which is low for this survey even though it’s significantly higher than headline CPI. 74.4% of respondents expect interest rates to rise in the next 12 months. The Fed funds rate will probably rise, but weak economic growth could limit long bond yields. Those with buying plans for homes were steady at 6.4%.
Weak World Trade Outlook
The tariffs don’t help world trade growth, but the main reason for weakness is cyclicality. The WTO’s outlook for trade growth in Q4 is 98.6 which signals growth will be below trend. 98.6 is down from 100.3 in August; it was the weakest reading since October 2016. The export orders index was 96.6 which is near the trough in 2012 during the EU crisis. If this trend continues, this slowdown will rival the 2016 weakness which some consider a recession. WTO expects trade growth to be 3.9% in 2018 and 3.7% in 2019. It was 4.7% in 2017.
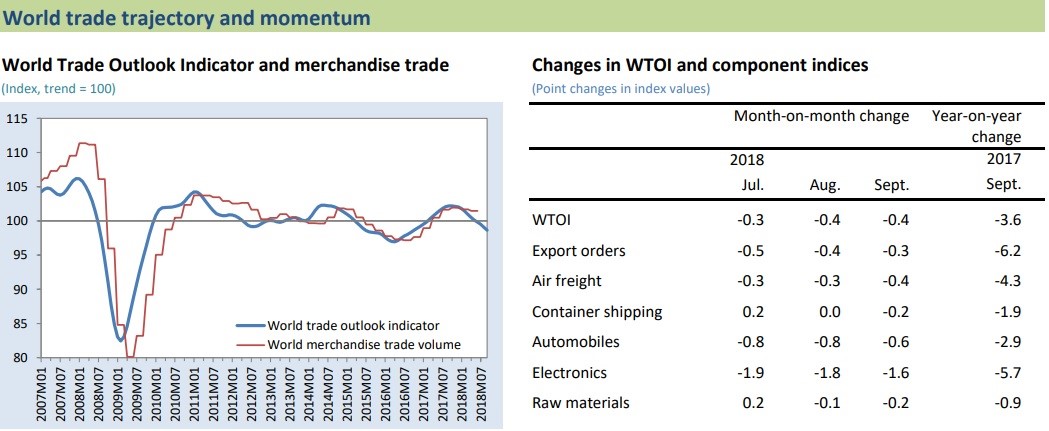
Source: World Trade Organization
Conclusion
The housing market has been weakening for a few months. The okay results from the 20 city HPI and the FHFA index shouldn’t change anyone’s mind on the industry because they are lagging reports. The good news is housing stocks have been doing well in the past few weeks. The Conference Board report shows us the labor market cycle is very close to its peak. The WTO outlook shows us trade growth is slowing largely due to cyclical weakness which is slightly amplified by the trade war between America and China. It will get worse if the proposed tariffs are implemented in 2019.