Wolf Richter wolfstreet.com, http://www.amazon.com/author/wolfrichter
The largest three-months fall “since at least the 80’s”: CoreLogic
“Can we still describe this as an orderly slowdown in housing conditions?” mused CoreLogic Asia Pacific’s head of research Tim Lawless about the Australian housing market today. Over the last three months, the index for Sydney dropped 4.5%, and the index for Melbourne 4.0%, the “largest rolling quarterly fall since at least the 80’s.”
Across the metro area of Sydney, prices of all types of homes combined, according to CoreLogic’s Daily Home Value Index, fell 1.35% in January from December, the third month in a row with a monthly decline of over 1%. The 4.5% decline over the past three months pencils out to an annual rate of decline of 17%. The index is now down about 12% from its peak in July 2017. Note the accelerating decline over the past three months:

The 12% drop from the peak in July 2017 pushed the index back where it been in July 2016 – which shows how crazy and unsustainable the price boom had been on the way up. Now it is getting unwound at a slightly slower pace on the way down.
Over the 12-month period through January, the index fell 9.7%, with house prices down 10.9% and condo prices down 6.9%. At the same time, the number of homes of all types listed for sale in the Sydney metro jumped by 24%.
Prices of more expensive homes are falling faster than the lower end of the market: In the top quartile of the market, prices fell 10.8% over the past 12 months and are down nearly 15% from the peak.
“Buyers are now in a position where they can negotiate harder, take their time in making a purchase decision and be selective in finding a home that is right for their budget and lifestyle,” the CoreLogic report said. “On the other hand, vendors are clearly facing more challenging selling conditions.”
In the Melbourne metro, the second largest market in Australia, the housing bust is also taking on momentum, instead of slowing down, but started about four months behind Sydney’s. According to the CoreLogic Daily Home Value Index, since the peak in November 2017, prices of all types of homes fell about 9%, which pushed prices back to January 2017 levels. Note the acceleration over the past three months:
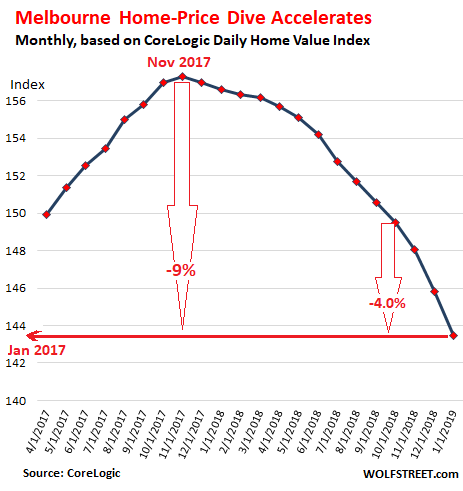
In Melbourne, too, the more expensive end of the market got hit the hardest: prices at the top quartile dropped 12.4% over the 12-month period and are down nearly 14% from their peak.
And supply is growing: the number of homes listed for sale in the metro jumped 34% from a year ago.
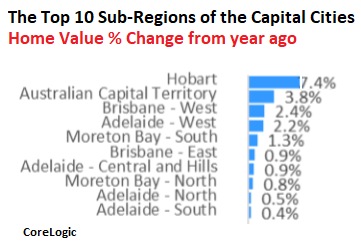
Across all capital cities, the picture is mixed, with some still booking year-over-year increases, such as Hobart, though its 7.4% rise is down from the double-digit increases last year. This list of the capital cities shows the percentage change of the CoreLogic Home Price Index for each city for the 12 months through January and the median “value” in Australian dollars:
- Sydney: -9.7% ($795,509)
- Melbourne: -8.3% ($636,048)
- Brisbane: 0.0% ($494,345)
- Adelaide: 0.9% ($430,711)
- Perth: -5.6% ($441,920)
- Hobart: 7.4% ($457,785)
- Darwin: -3.5% ($412,940)
- Canberra: 3.8% ($596,933)
The national CoreLogic index has dropped 6.1% from its peak in October 2017, largely driven by the vast Sydney and Melbourne markets. This pushed the index back to where it had been in October 2016.
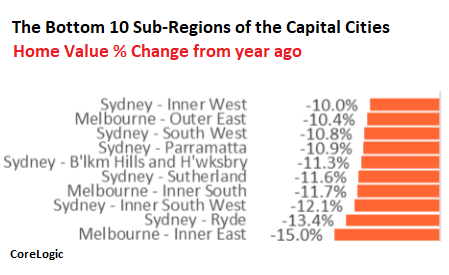
But there are large differences, with prices in some sub-regions plunging, while rising in others. On CoreLogic’s list of the 10 weakest performing sub-regions of the capital cities, seven are in the Sydney metro and three are in the Melbourne metro (image via CoreLogic’s report):
In some other sub-regions of the capital cities, prices rose, but none of the top 10 are in the metros of Sydney and Melbourne (image via CoreLogic’s report):
The report blames the “the worsening conditions” of the housing market primarily on these factors:
- “Tight credit conditions”
- “Weakening consumer sentiment”
- “Less domestic and foreign investment”
- “Higher levels of housing supply.”
Note the absence of interest rates on this list of factors. The Reserve Bank of Australia cut its policy rate to a historic low of 1.5% in August 2016 and has kept it there. Mortgage rates are hovering near historic lows. This would normally stimulate a housing market. But no.
Sky-high prices that have become unaffordable are reason enough to prick a bubble. Part of the reason the bubble even inflated this far is the now widely disclosed scandal of banking and mortgage shenanigans, along with crazy levels of investor speculation, supported by the same banking and mortgage shenanigans. After a lot of media coverage of these shenanigans, and after continued revelations about them by the Royal Commission, there is now pressure on banks to clean up their act, and this results in — to use CoreLogic’s phrase — “tight credit conditions.”
And CoreLogic adds: “Housing finance conditions are likely to remain tight after the hand down of the Hayne Royal Commission report which is due on Monday.” Hence, more revelations and more pressures on the banks to clean up.