Wolf Richter wolfstreet.com, http://www.amazon.com/author/wolfrichter
Dallas-Fort Worth, not San Francisco, is in second red-hottest place.
Consumers in Los Angeles are simply not buying the notion that inflation, however benevolently measured by the Consumer Price Index, was “only” 2.8% in May, as we learned today. And they were right, according to the Bureau of Labor Statistics. So here we go.
Earlier today I dissected consumer price inflation for all of the US, with a particular eye on the “hedonic quality adjustments” that are liberally and aggressively applied to used and new cars and trucks.
These hedonic adjustments conjure up a breathlessly miraculous situationwhere the Consumer Price Index in May for used vehicles is at the same level as it was in 1994 — with no inflation whatsoever over the 24-year period — and where the price index for new vehicles is where it was in 1997, though actual vehicle prices, the amounts car buyers have been paying, have skyrocketed over those years.
Now drilling down by geography: Overall, for urban consumers across the US, CPI rose by 2.8% in May from a year ago, the fastest year-over-year rise since February 2012. But how does this work out for the four regions of the US, and for the largest metros?
The Bureau of Labor Statistics releases a trove of inflation data every month, including data for the 14 largest Metropolitan Statistical Areas (MSAs). Among these MSAs, CPI ranged from lukewarm in the Philadelphia-Camden-Wilmington MSA, at 1.4% year-over-year, to red-hot for the Los Angeles-Long Beach-Anaheim MSA, at 4.1% year-over-year, which is about double the Fed’s target.
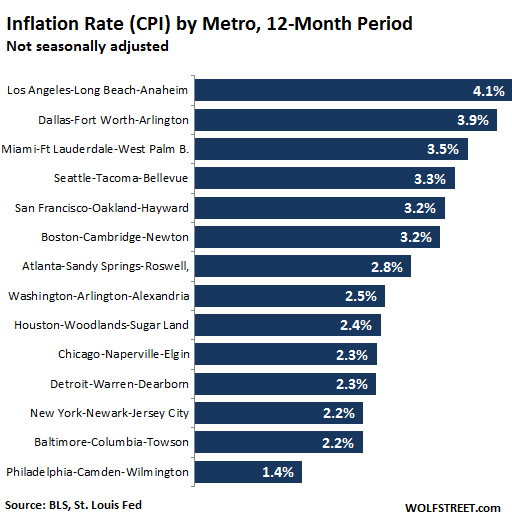
Note that the Dallas-Fort Worth-Arlington metro is not far behind the Los Angeles metro.
For some of these MSAs, the BLS releases monthly data. For others it releases data every other month. So some of the inflation rates in the chart above are for May-to-May comparisons, others are for April-to-April comparisons.
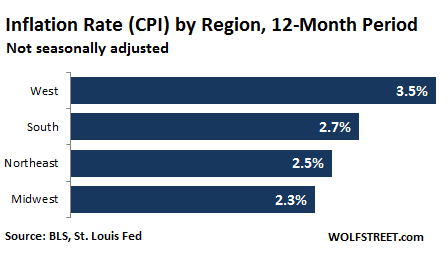
By region, CPI averages out some of the extremes. In May, compared to a year ago, CPI was hottest in the West and least hot in the Midwest (here’s a map showing which states are included in these regions):
How individuals experience inflation depends on a lot of factors, including the basket of goods and services they’re buying. If they’re renters in a city where rents are soaring, and if a relatively large portion of their spending goes to tuition and healthcare expenses, their personal inflation rate could be much higher than the national average. And location — as the folks living in Los Angeles, Dallas, and some other places are experiencing painfully on a daily basis — is a big factor in this equation.