
by Dana Lyons

Various measures of the overall market of stocks are giving mixed signals; is it a sign that the broad market will lead stocks to new highs or a dangerous divergence portending a top?
As you may know, when it comes to analyzing the prevailing equity investment climate, we are strong advocates of focusing on market internals, i.e., breadth. In other words, we want to see a large percentage of stocks participating to the upside as confirmation of the true strength and durability of a rally. And while we use some complicated measures of breadth, the task of deciphering internal strength is typically fairly straightforward. However, on occasion, the picture may not be so clear. Now is such an occasion.
We say this because we are seeing various measures of internal strength painting very different pictures. For example, the chart below indicates that 2 of our favorite broad measures are diverging substantially.
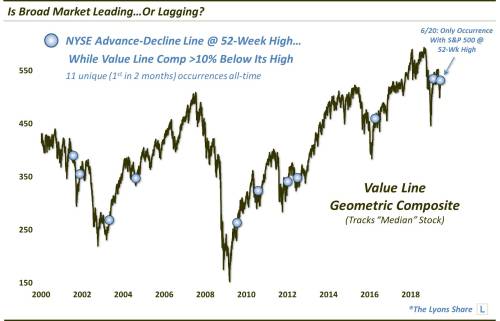
As indicated, while the NYSE Advance-Decline Line traded at a new 52-week high last week, the Value Line Geometric Composite (VLG), which tracks the performance of the “median” stock in the market, was well off of its own 52-week high. In fact, on June 20, the VLG was more than 10% below its high while the A-D Line set a new all-time high. As the chart states, this is only the 11th unique occurrence of all-time (i.e., only counting the first occurrence in 2 months). Incidentally, this was the first occurrence in history in which the S&P 500 itself closed at a 52-week high.
So which measure is correct? Does the strength of the NYSE A-D Line suggest that stocks are headed to new highs again? Or is that series perhaps tainted by the plethora of bond-like, interest sensitive issues on the NYSE. That hasn’t mattered in the past, but it could be a factor today. Thus, could the vast underperformance by the VLG be an ominous warning of the thinning out of the stock rally?
In a Premium Post at our All-Access site, The Lyons Share, we break down the statistical aftermath of the previous 10 readings to ascertain, from a historical perspective, what this signal may be telling us. This includes, finding out whether there is a consistent edge for investors following such signals – and over what duration. And are there any prior signals that perhaps bear closer resemblance to our present case than other signals?