Authored by Lance Roberts via RealInvestmentAdvice.com,
Last week, Barron’s ran an article entitled “The Stock Market Is Just As Confused About A Potential Recession As You Are?” To wit:
“Investors have long used where we are in the economic cycle to decide which stocks to buy and sell. New research from Nomura’s Joseph Mezrich flips that on its head by showing how investors can use stock performance to help determine where we are in the cycle. Too bad the market is sending mixed messages right now.”
But let’s be clear here; no one wants the party to end. So, despite a struggling stock market over the last year, slowing economic growth, and a collapsing yield curve, there are still plenty of articles suggesting you should just ignore it all and remain invested.
“Economist Ryan Sweet of Moody’s Analytics has a message for his fellow economists who are predicting a recession in the next year: ‘The Fed isn’t going to kill this expansion.’” – Ryan Sweet of Moody’s Analytics
But then he goes on to make an interesting statement:
“Recessions are typically caused by one of two things, he says: Imbalances develop in the economy or financial system (like a bubble in the stock market or in housing), or the Federal Reserve panics and raises interest rates too much in response to unexpected inflation caused by an overheating economy. Neither of those triggers is present.”
Uhm….okay…maybe Ryan just doesn’t get out of the house much but saying there isn’t a bubble in the stock market is like saying Mount Everest is just a mountain.
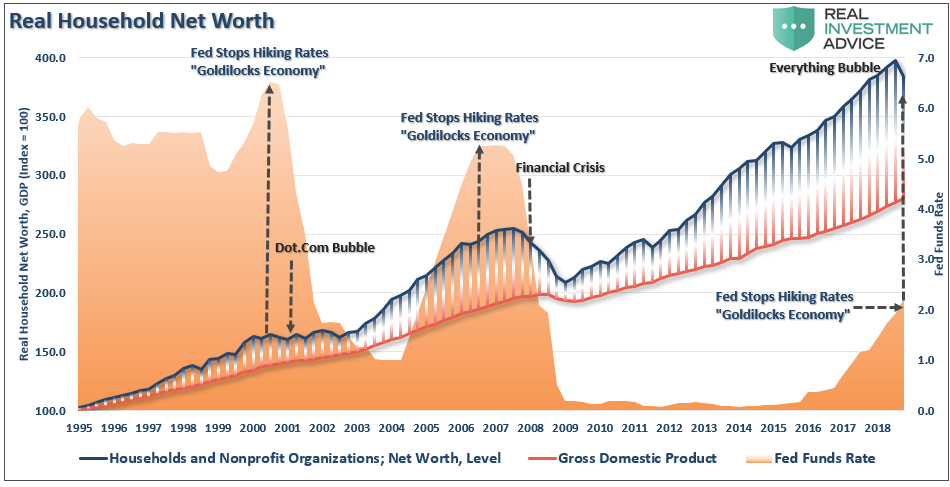
Also, with respect to his point that the Fed isn’t going to kill this expansion, well that too may also be a bit myopic. As shown, the Fed has been hiking rates to offset the specter of inflation which doesn’t exist to any great degree and have likely gone too far. We suspect this, because the recent reversal in policy is akin to what we have see repeatedly in the past. The Fed tends to stop hiking interest rates when they realize they have caused problems within the economy, like a sudden downward shift in housing, autos, and asset prices.
Sound familiar?
The problem with all of the mainstream claims that there is “no recession in sight” is those claims are based on analysis of unrevised and lagging economic data.
This is an incredibly important point.
The problem with making an assessment about the state of the economy today, based on current data points, is that these numbers are “best guesses” about the economy. However, economic data is subject to substantial negative revisions in the future as actual data is collected and adjusted over the next 12-months and 3-years. Consider for a minute that in January 2008 Chairman Bernanke stated:
“The Federal Reserve is not currently forecasting a recession.”
In hindsight, the NBER, eleven months later, announced that the official recession began in December of 2007.
“But if the Federal Reserve can’t predict a recession, no one can.”
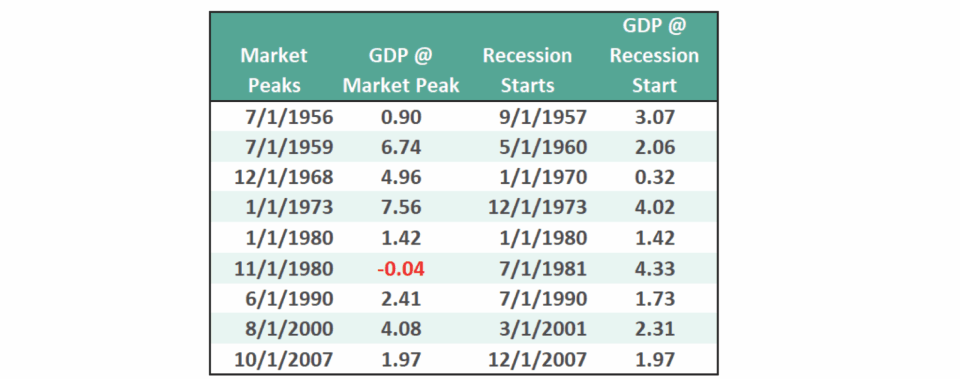
Well, that isn’t necessarily correct. For example, let’s take a look at the data below of real (inflation-adjusted)economic growth rates:
- September 1957: 3.07%
- May 1960: 2.06%
- January 1970: 0.32%
- December 1973: 4.02%
- January 1980: 1.42%
- July 1981: 4.33%
- July 1990: 1.73%
- March 2001: 2.31%
- December 2007: 1.97%
Each of the dates above shows the growth rate of the economy immediately prior to the onset of a recession (this is historically revised data). If Ryan had been making his comments about the economy in 1957, it would have sounded much the same way.
“The recent decline from the peak in the market, is just that, a simple correction. With the economy growing at 3.07% on an inflation-adjusted basis, there is no recession in sight.”
You will note in the table above that in 6 of the last 9 recessions, real GDP growth was running at 2% or above.
At those points in history, there was NO indication of a recession “anywhere in sight.”
But the next month one began.
So, is the market really sending mixed messages?”
The Market Isn’t Confused
This is also likely a mistaken assumption. In reality, it may just be the unwillingness of “eternally optimistic”individuals to pay attention.
Take a look at the chart below. The green dots mark the peak of the market PRIOR to the onset of a recession. In 8 of 9 instances the S&P 500 peaked and turned lower prior to the recognition of a recession.
In other words, the decline from the peak was “just a correction” as economic growth was still strong.
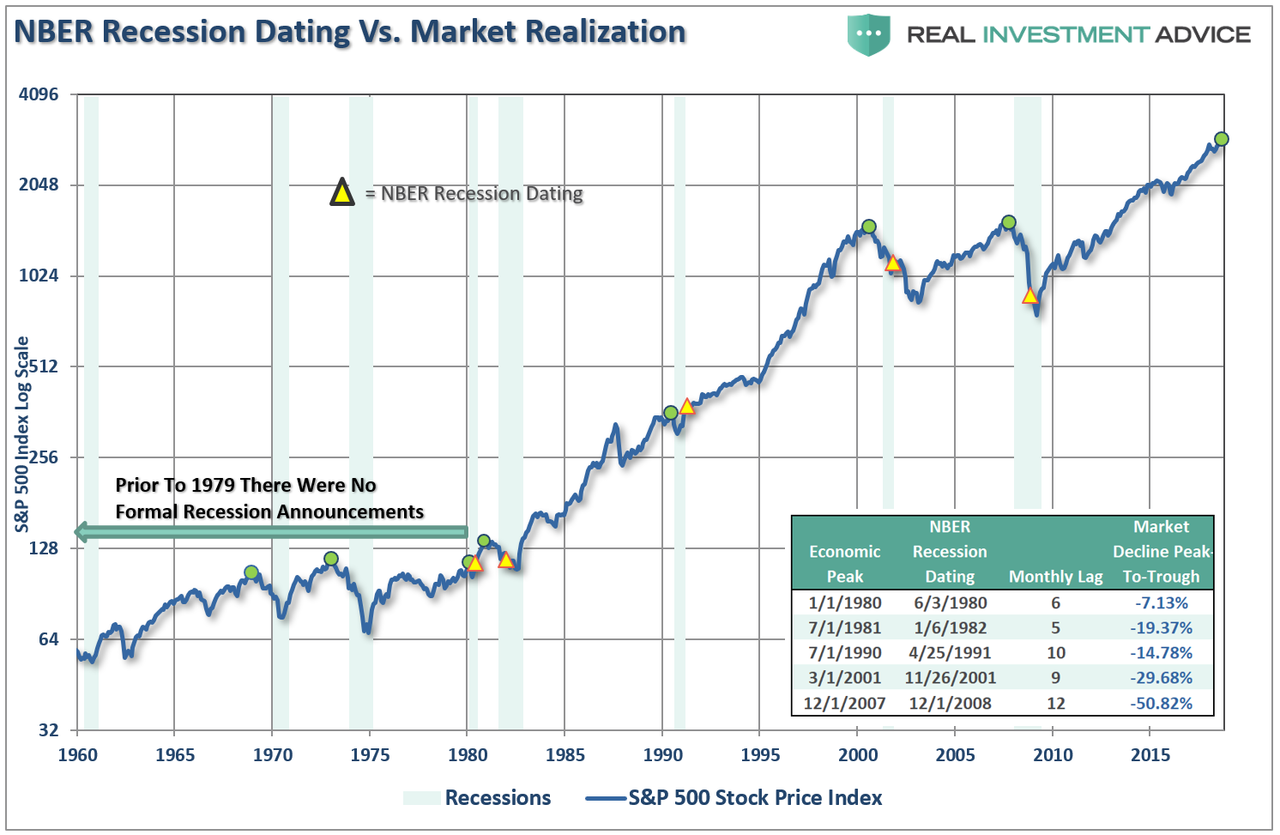
In reality, however, the market was signaling a coming recession in the months ahead. The economic data just didn’t reflect it as of yet. (The only exception was 1980 where they coincided in the same month.) The chart below shows the date of the market peak and real GDP versus the start of the recession and GDP growth at that time.
The problem is in the waiting for the data to catch up.
So, if you really can’t count on economic data to “alert” you to the onset of a recession, what can you use.
Well, by looking at the chart above, it is clear the stock market leads economic downturns. Also, as we have written about previously, so do yield curve inversions. The chart below combines both which shows this is indeed the case. In every prior instance going back to 1980, the stock market began to peak as the yield curve began to invert.
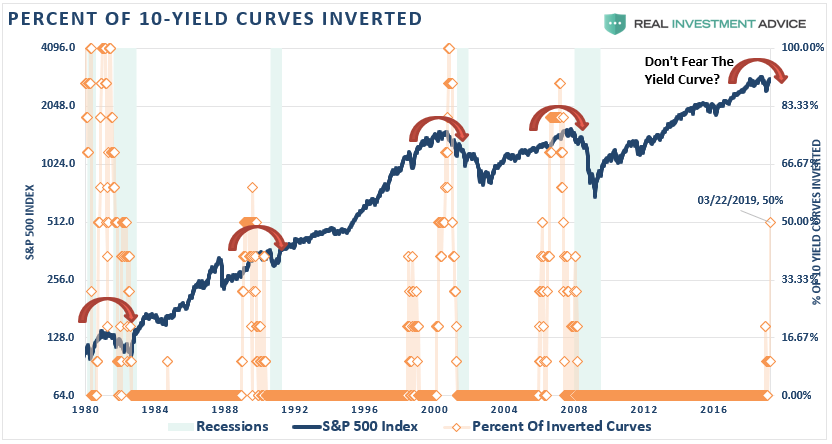
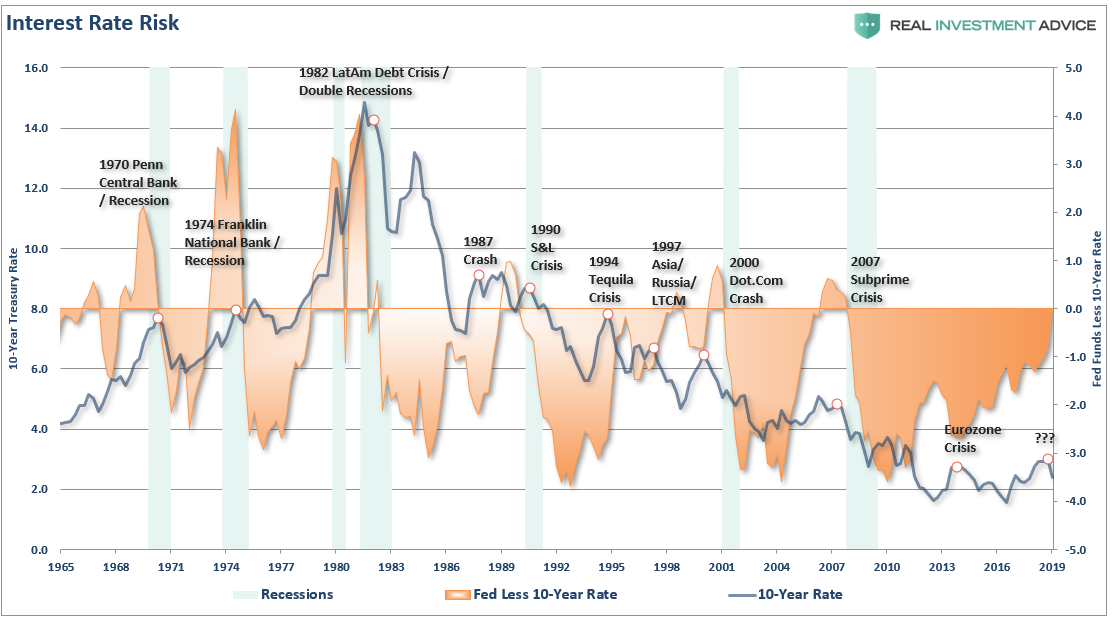
Also, when the Fed Funds rate exceeds the 10-year Treasury, that too has been a pretty strong indication of both market problems and the onset of a recession. Currently, the spread between those two particular rates (at the time of this writing) is +0.0%.
But even this warning has been met with criticism. Just recently, Dallas Fed President Robert Kaplan stated, with respect to the potential for the Fed to lower interest rates:
“I’d need to see an inversion of some magnitude and/or some duration, and right now we don’t have either. If you see an inversion that goes on for several months…that’s a different kettle of fish, but we’re not there yet.”
The problem for the Fed is in the waiting. A look back at the charts above show there are only two occasions going back to the 1970’s where the yield curve inverted and it didn’t lead to a recession. The problem with “patience” is that by the time the Fed does act, it will likely be too late which has historically always been the Fed’s problem.
Furthermore, the “yield curve inversion” is NOT the illness of the market, rather it is the symptom of virus infecting the economic environment. David Rosenberg just recently penned a rather exhaustive list.
- The Fed turned TOO dovish, taking out not one, but both pledged rate hikes for this year and trimming its GDP forecasts.
- The stock market didn’t mind the futures market pricing out future tightening, but discounting rate cuts means the Fed DOES see something nefarious around the corner. Market-based odds of the next move being a policy easing have jumped to 58% from 30% a week ago and 5% a month ago! Remember, the best time to “buy” the market is on the last rate cut, not the first one.
- The 10-year/3-month yield curve finally inverted, albeit fractionally, for the first time since August 2007. This is not an infallible indicator, but predicts recessions with 85% accuracy.
- Not only has the yield curve inverted, but the composition of the drop in bond yields should be a worry sign to equity investors. While inflation expectations have receded to 1.9% (for 10-year break-evens,) fully 85% of the slide in Treasury yields has come from the “real rate,” which has collapsed to a mere 0.55%. The bond market is thus looking the stock market straight in the eye and saying “this rough patch in the economy and recession in corporate profits ain’t no one-quarter wonder.”
- The President has sought to pick a fight with Jay Powell by nominating his long-time supporter Stephen Moore to the Fed as Governor. If this happens, one can expect dissension to rise at the Central Bank. Moore is such a hypocrite that he penned a paper in 2014 criticizing the Fed for its QE largesse and for not raising rates – and now he’s been openly insulting to Jay Powell (going so far as to call for his resignation) for doing what Moore was clamoring for a half-decade ago. One more step towards trying to politicize the institution. (A strong case here for gold.)
- In addition to the uncertainty now at the Fed – Neel Kashkari is not being shy that a policy misstep has been made as he second-guesses even his 2.5% estimate of the “neutral” funds rate. We have a fiscal situation in the USA that also is destabilizing and clearly crowding out private investment. In Feburary, the budget deficit hit a record $234 billion, which is pure insanity (up 9% from a year ago). In all of 2006, the gap was $248 billion. In 2007, the peak of growth in the last cycle, the annual deficit was $161 billion – lower than the past month. When I started in the business in 1987, the annual deficit that year was $150 billion. Now, we do more than that in just one month. And, this level of debt-laden government intervention in the economy is really worth of a forward P/E mulitple that up until recently was pressing against 16x?
- The flat-to-inverted yield curve is killing the banks. The S&P 500 Financials were crushed 5% last week; the regional banks were down 9.4%. The KBW Nasdaq Bank Index suffered its biggest one-week loss since 2016.
- The Atlanta Fed is down close to zero percent on Q1 growth and the NY Fed sees the first half of the year at 1.4%, or half of the 2018 pace.
He had multiple more points in his “must read” daily missive, but you get the idea.
Nonetheless, we are still told to disregard the warnings because this “time is different.”
“‘Historically the inversion of the yield curve has been a good [sign] of economic downturns [but] this time it may not,’ because the normal market signals have been distorted by, ‘regulatory changes and quantitative easing in other jurisdictions…everything we see in terms of the near-term outlook for the economy is quite strong.’” – Former U.S. Fed Chair Ben Bernanke, July 2018
“I think that there are good reasons to think that the relationship between the slope of the yield curve and the business cycle may have changed…the fact the term premium is so low and the yield curve is generally flatter is an important factor to consider.” – Former U.S. Fed Chair Janet Yellen’s final press conference, December 2017
Of course, given the track record of the Fed, maybe you should think differently.
With valuations at 30x trailing 10-year earnings, the risk to capital is quite substantial. As Larry Berman recently discussed for BNN Bloomberg:
“The P\E in a recession trough is probably between 11-13 times earnings. Earnings tend to fall about 15-20 per cent in an average recession. This one is probably worse than average largely due to the massive increase in leverage over the cycle suggest the downturn would be longer and deeper. If earnings fall by 30 per cent and the multiple is 11x, the S&P trough value is around 1,300. The optimistic scenario is a 15 per cent decline in earnings and a 13X multiple puts the S&P 500 around 1850. As an FYI, earnings fell by about 50 per cent in 2008-09 recession. Bottom line is a BIG Bear market for equities is likely and passive ETF portfolios will tend to disappoint.”
He is right. During “average” recessions stocks reprice forward expectations by 30% on average. However, given the massive extensions in markets over the last decade, Larry’s targets above suggest a 50% decline is possible.
Don’t Ignore The Warning
During the entirety of 2007, the trend of the data was deteriorating and the market had begun to struggle to advance. The signs were all there that “something had broken” but the “always bullish” mainstream media encouraged investors to simply ignore it as it “was different this time.” Unfortunately, by the time the annual data revisions had been released by the Bureau of Economic Analysis (BEA), it was far too late to matter.
Today, we are once again seeing many of the same early warnings. If you have been paying attention to the trend of the economic data, the stock market, and the yield curve, the warnings are becoming more pronounced.
In 2007, the market warned of a recession 14-months in advance of the recognition.
Today, you may not have as long as the economy is running at one-half the rate of growth.
However, there are three lessons to be learned from this analysis:
- The economic “number” reported today will not be the same when it is revised in the future.
- The trend and deviation of the data are far more important than the number itself.
- “Record” highs and lows are records for a reason as they denote historical turning points in the data.
We do know, with absolute certainty, this cycle will end.
“Economic cycles are only sustainable for as long as excesses are being built. The natural law of reversions, while they can be suspended by artificial interventions, cannot be repealed.”
Being optimistic about the economy and the markets currently is far more entertaining than doom and gloom. However, it is the honest assessment of the data, along with the underlying trends, which are useful in protecting one’s wealth longer-term.
The market, and the yield curve, are trying to tell you something very important.