
Authored by Sven Henrich via NorthmanTrader.com,
Reality Check
This week the headlines declared the bear market over as the S&P 500 joined the Nasdaq to make new all time highs. A new bull market has begun so the celebratory narratives. It is true these indices have made new all time highs, but the actual market hasn’t. Not even close. These indices have made new all time highs as 6-7 stocks are experiencing the largest and most aggressive market cap expansion in human history distorting everything.

Yet perception is reality and the bullish narratives keep mounting as key tech stocks and their oversized weight are contributing to the main indices relentlessly drifting higher so let me at least provide some perspective as to what’s going on with the larger market.
Firstly note we continue to be in uncharted waters here in terms of the concentration of individual stocks vs GDP as well as the Fed’s balance sheet:
The first top 5 stocks now represent 25% of the S&P 500, a concentration in weighting we’ve not seen since 2000. The market cap expansions we see on a daily basis in some of these stocks, such as $AAPL and $TSLA for example, put even the year 2000 bubble to shame.
Just on Friday $AAPL added over $100B in market cap out of thin air on no fundamentally driven news. The stock now having added over $1.1 trillion in market cap since the March lows.
None of this has even a historic approximate reference point and so one must recognize that this market phase is a unique one on its own.
And of course $TSLA is the other popular post child of this era:
None of these companies have produced results that justify these historic market cap expansions in such a short period of time, but they provide cover for the illusion that the bear market is over and that a new bull market has begun. There is little doubt these stocks are in a bull market. I call it a historic bubble, but don’t let anyone tell you the “market” is in a bull market.
It’s not and the value line geometric index shows you this clearly:
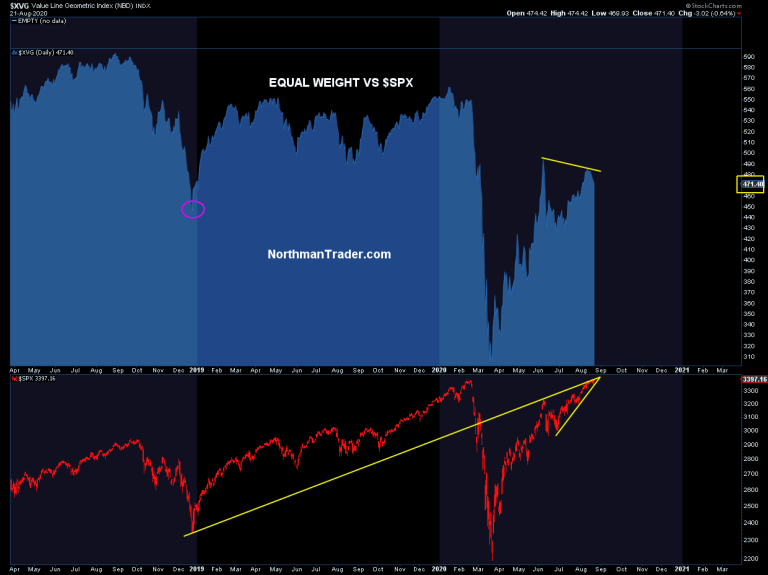
While the index made new highs the $XVG produced lower highs versus June and remains far below the 2020 highs or the 2018 highs for that matter.
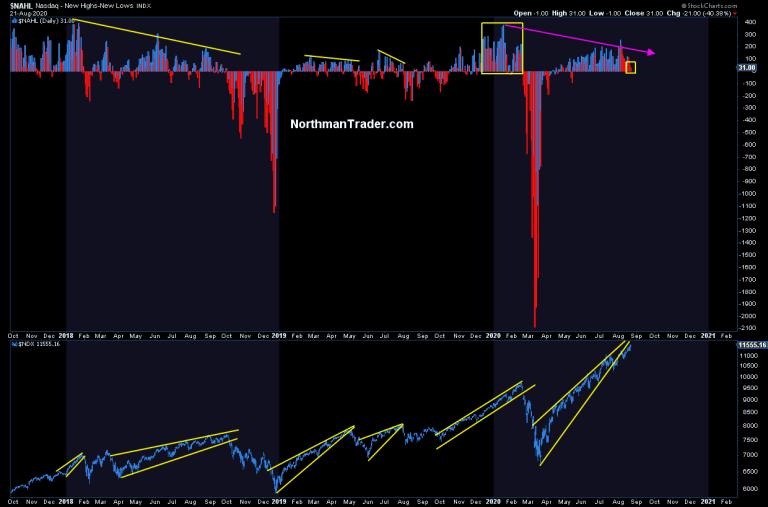
Even in the almighty Nasdaq the internal picture is atrociously crumbling before our very eyes, be it on new high/vs new lows:
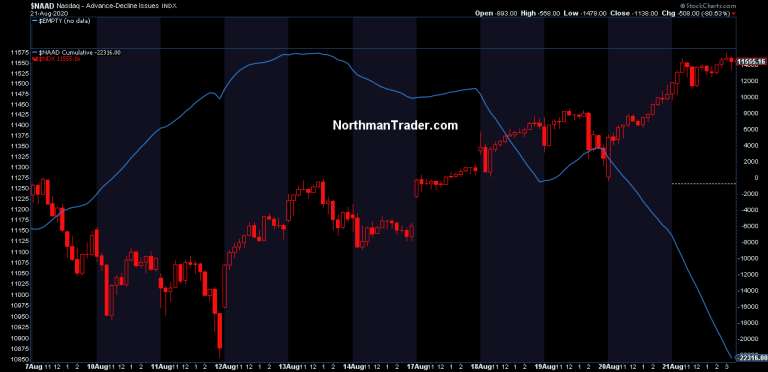
Or be it on the cumulative advance/decline:
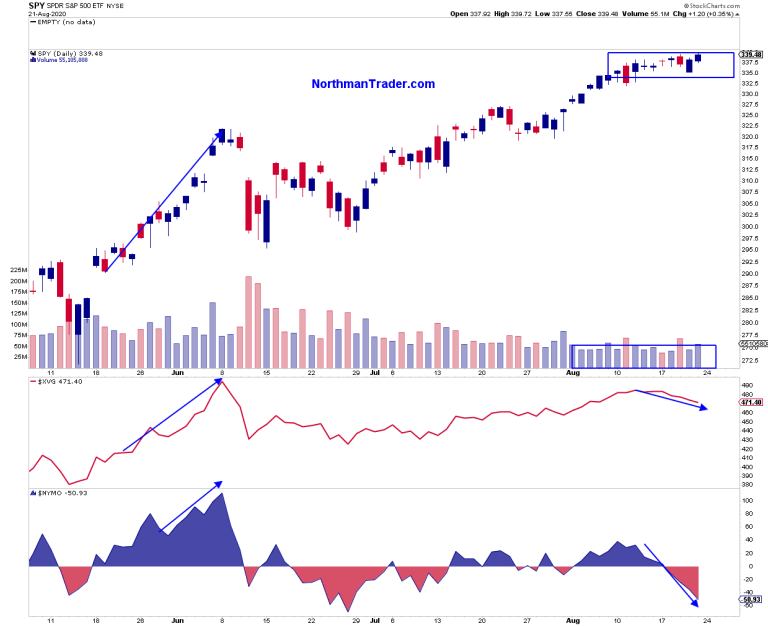
Indeed we can observe that the relentless crawl to new highs on the index shows a correction underneath with $NYMO hitting below -50 while $SPX closed the week on a new high with equal weight deteriorating and volume entirely collapsing:
Banks dropped over 10% from the August peak and remain below the December 2018 lows and far below the June highs:

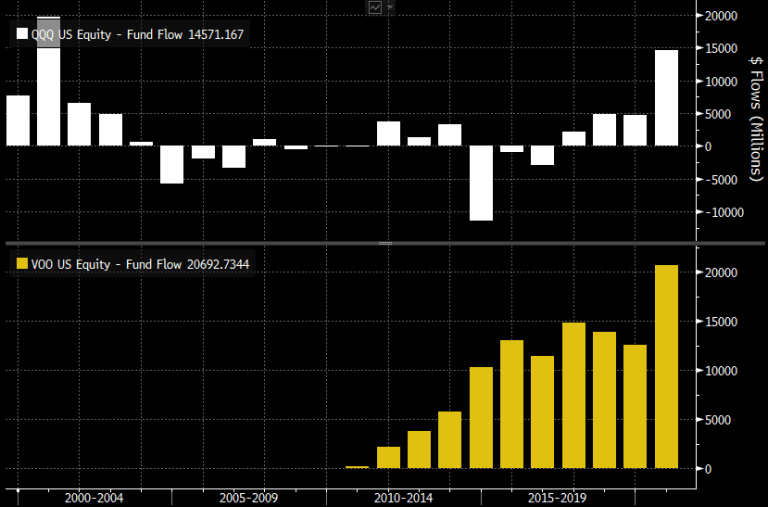
No, it’s all tech, and select tech at that as investors are relentlessly piling into $QQQ, an ETF that has a 56% market cap weighting exposed to just 10 stocks:
No, the “market” is weak underneath and is more reflective of the reality that 7 stocks and relentless artificial liquidity are masking:
This economy is far from recovered, yet markets are now trading at an all-time high of 179% market cap to GDP and the potential fuel of shorts has all but disappeared:
Next week Jay Powell, who is personally killing it in this market, will speak at Jackson Hole. If there is any conscious recognition on his part as to the historic distortions created by his unprecedented liquidity injections shall remain unknown to all of us. If he has any sense of the enormity of the distortions created he’ll aim to softly try to ease participants off of the dangerous chase into tech stocks for fear that a bursting bubble will cause more damage down the road. But that would require him to not only have cognition of the distortions created, but also take some pain in his personal ETF portfolio. The obvious conflict of interest appears to be a taboo in the financial media for some reason.
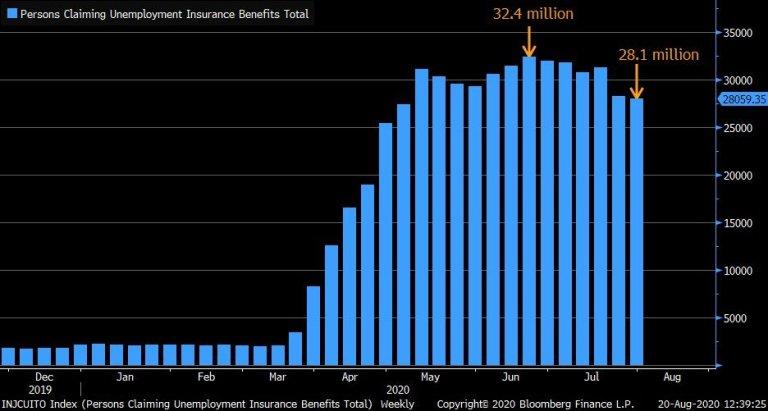
Why not ask him: “Mr Powell, how much money have you personally made this year as a result of the liquidity injections you have implemented? In light of these amounts, while over 28M Americans are still claiming unemployment benefits, how can you claim the Fed does not contribute to wealth inequality?” Let him go on record:
I’m sure these 28M Americans would love to know how the Fed is helping them by buying bonds in a $2.1 trillion market cap company.
Bottomline: The larger market is struggling, correcting even as the rotation trade once again was left in the dust of another vertical chase into key tech stocks which are now historically overvalued, technically extremely stretched and at ever higher risk of a violent technical reversion. Month end is again approaching and perhaps the rotation trade may once again be a vehicle of choice as these February gaps remain (see also $DJIA and $VIX).
I’ll leave you with a replay of an 30 min interview I recorded this Thursday evening with the folks over at PeakProsperity with my latest views on the current situation:
* * *
For the latest public analysis please visit NorthmanTrader. To subscribe to our market products please visit Services.