It’s been 20 years since the last major peak in the US Dollar. Could the greenback’s latest turn lower confirm another peak?
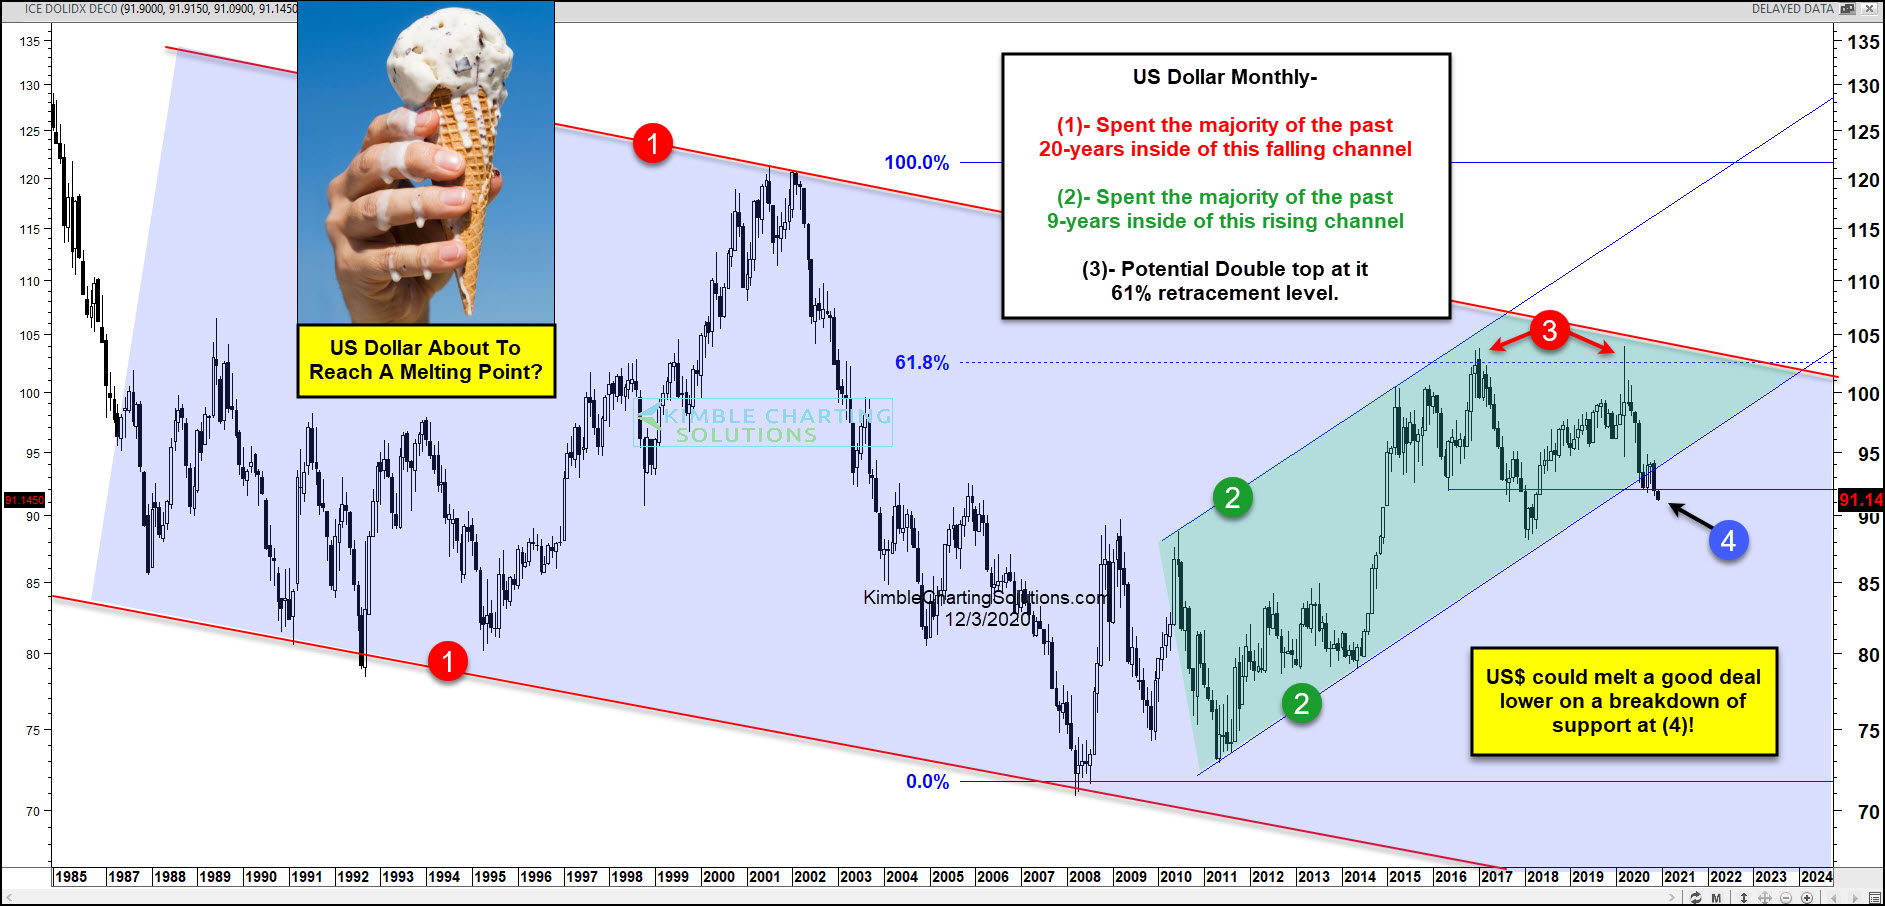
Today’s chart takes a macro view of the US Dollar Index and highlights the long-term down-trend at each point (1). As you can see, the buck is on a topsy turvy ride, bouncing up and down within this down-trend.
The latest bottom formed after the financial crisis and has seen the US Dollar trade within a 9 year up-trend channel marked by each (2). This gave bulls some confidence that the US Dollar may have formed a long-term bottom… Not so fast!
The broader down-trend may be exerting its force here. The US Dollar Index has formed a potential double top pattern right at its 61.8% Fibonacci resistance (as well as down-trend line resistance) – see point (3).
This bearish formation includes a recent move lower that is attempting to break a confluence of support at (4), including lateral and up-trend support lines.
The buck could melt a good deal lower if this support gives way. The next short-term support test comes into play around 87, then 82.