via Thomas Thornton of Hedge Fund Telemetry

As the markets grind higher into the year-end the look of what is happening is becoming clear. The Fed is inflating a bubble. Valuation on the S&P is approaching 19x which is up from ~14-15x a year ago. Valuation isn’t a great tool for timing however when multiple expansion is accepted by the market it should be respected. Sentiment a year ago was 4% on the Daily Sentiment Charts and 3% on the CNN Fear and Greed Index and today both are extreme. They have been elevated to an extreme for the last few months and as I’ve said: “sentiment is a condition and one must have a trigger to turn after an extreme reading.” A year ago in December, I counted 240 downside DeMark buy Countdown 13’s within the S&P and there are only upside sell Countdowns triggering daily. I couldn’t be more cautious at this point just as I couldn’t have been more bullish exactly a year ago.
I’ve recently written about how sellers are unmotivated (as they always sell lower), and how the US-China trade watered-down deal is a sell the news event, and then how this market reminds me of a musical chairs market. I recently spoke at a wealth management conference and the overwhelming thing I heard was how they wanted to get into 2020 to sell. We might start to sell a little selling starting with $41bn of 5-yr notes being issued on 12/24 and $32bn 7yr notes on 12/26. This will take away some of the Fed’s liquidity that has caused this bubble. At the end of the month, there will also be pension rebalancing with a rotation out of stocks into bonds. Considering the lack of liquidity it could spook some people headed into the new year. On the thought of the end of the new year, it will close a “great year” thanks entirely to last year’s starting point after a crushing Q4 2018. The S&P is up about 8% from the peak in September 2018 so all of those people who are long term holders who didn’t sell ahead of the down Q4 are up moderately. Still, I’m not dismissing the year since the third year of a Presidential cycle is the strongest. I even said at the beginning of the year I expected gains of 15% across the board for US, European, and Asian stocks.
Today’s report has a lot more stuff than usual as I’m going to post a shorter note tomorrow and will be taking time off to spend with my family over the holiday and will be back on Friday. On the Trade Ideas Sheet (on the site) I covered AMD and SMH at losses. The fundamentals still don’t make sense and I still have some semi and tech short exposure (including a February XLK put spread). I’m holding some index shorts into the new year at losses begrudgingly and have fresh SPY and QQQ put spreads that are closer to reality that would make up the index losses quickly when they work. I’m adding JNJ, JPM, GS, and CMG as new shorts. Charts with annotations are on the Trade Ideas page when you click the symbol. Finally, Tesla has continued its miracle move higher and truly is the poster child for today’s bubble. It had the Sequential Countdown and I said the other day the Combo is close. I will hold the recent options trade that has 30x potential into February.
I want to say thank you for all your continued support and Merry Christmas and happy holidays to you and your families. Here’s to 2020.
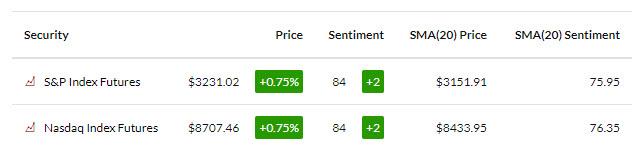
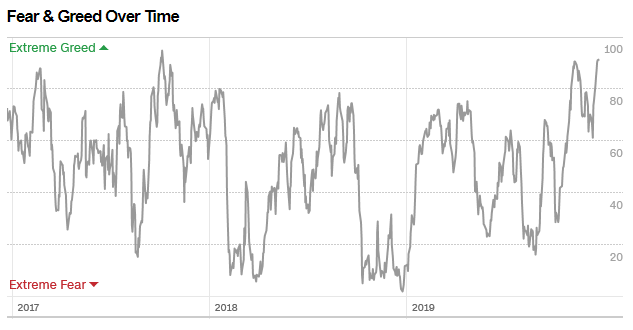
US MARKET SENTIMENT IS EXTREME
Extreme above 80%
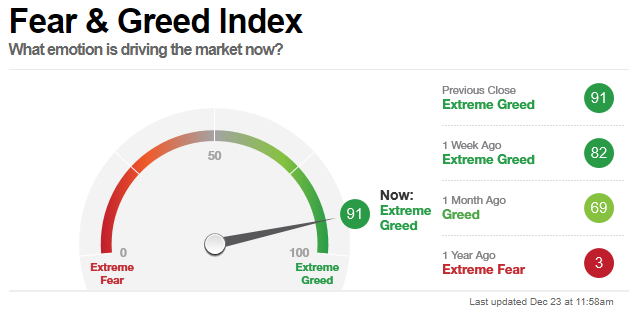
I love the CNN Fear and Greed as it shows what people are doing rather than what they are saying. It’s 91% today vs 3% a year ago. I couldn’t be more bearish with this reading as I couldn’t have been more bullish a year ago.
US MARKETS
Drifting higher. Levels I’m watching 3195 (I’m told a CTA sell level) and the 3184 10 day moving average
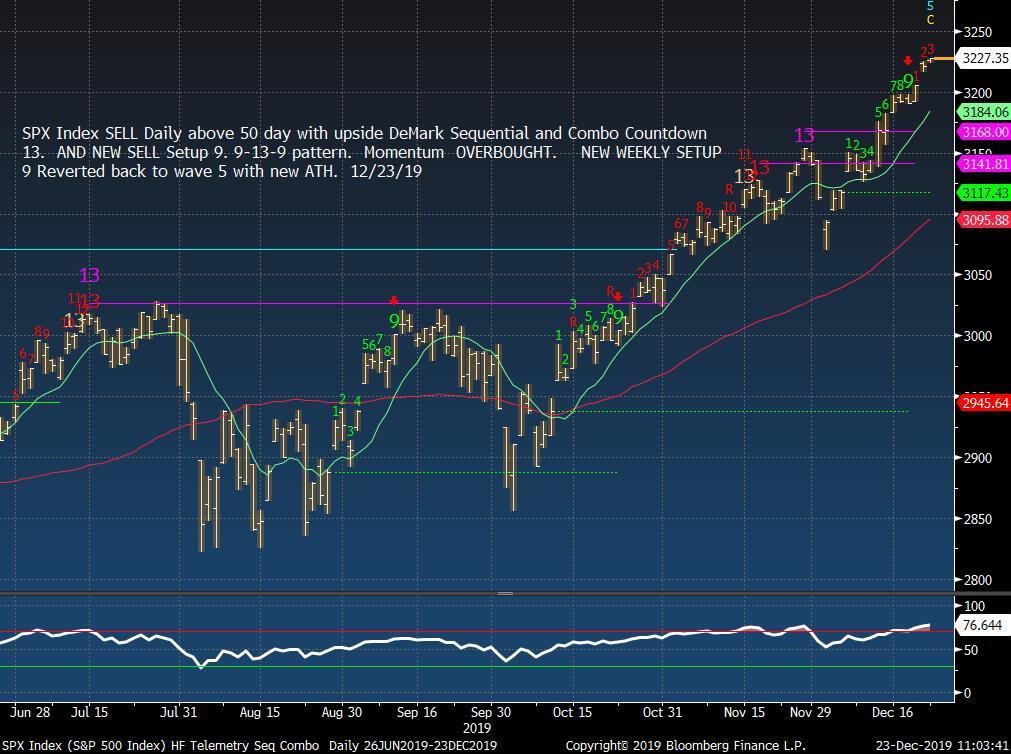
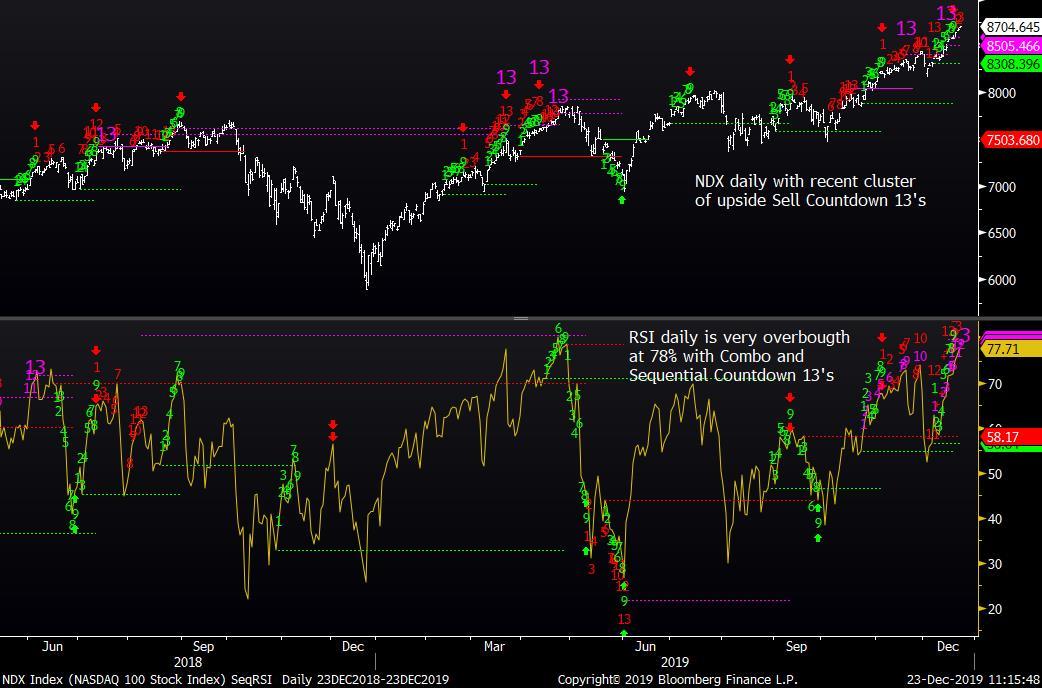
RSI readings on daily are not only very overbought on the S&P and Nasdaq at 76% and 77% but there are DeMark Countdown 13’s signifying a peak in the RSI reading

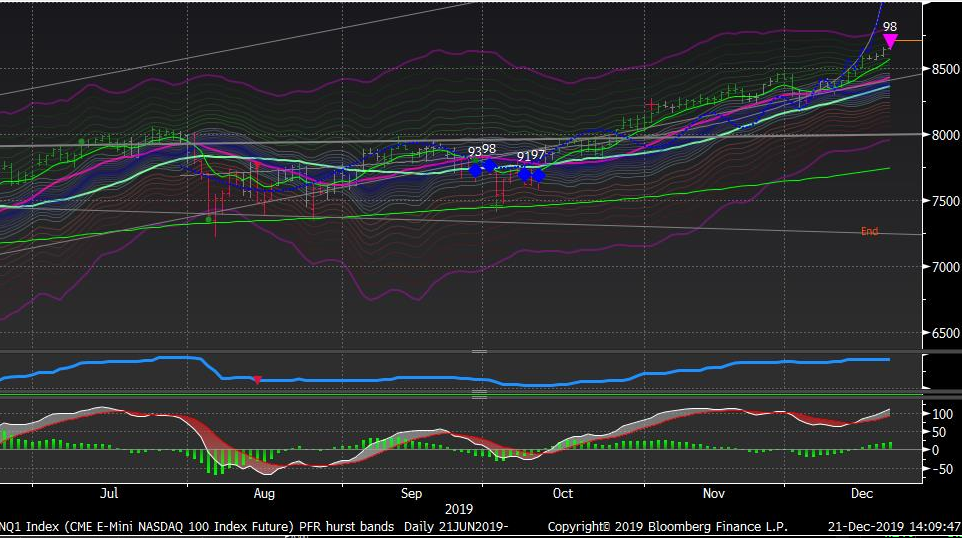
I’ve been studying the Hurst technical indicators. A client sent me this sell signal on the Nasdaq
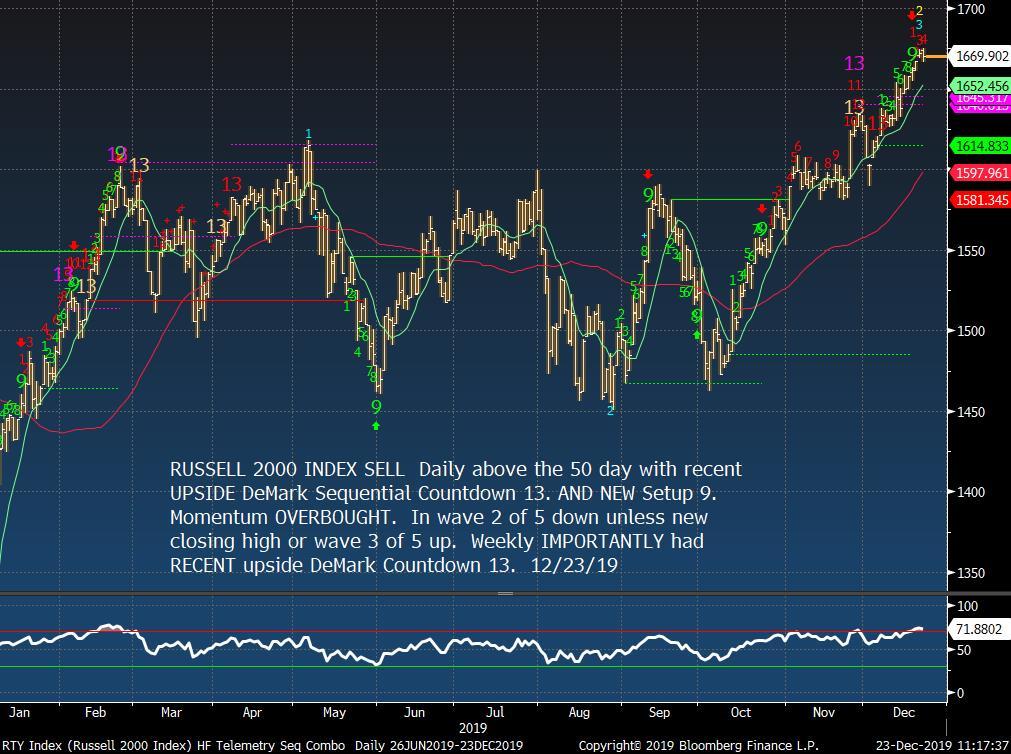
Russell 2000 also overbought
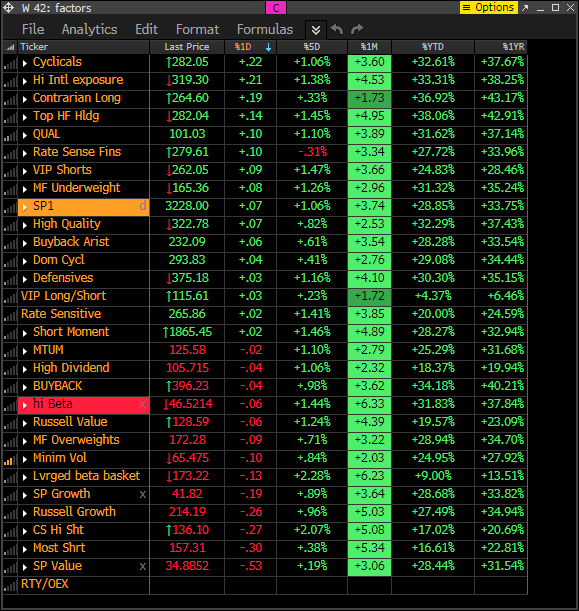
FACTORS – ABOUT TO CHANGE IN THE COMING DAYS
The Factors look GREAT but this is due to this being the anniversary of the Q4 low. It will be reset in 2020 and CNBC can’t talk about how something is up X% for the year. FOMO is coming to an end
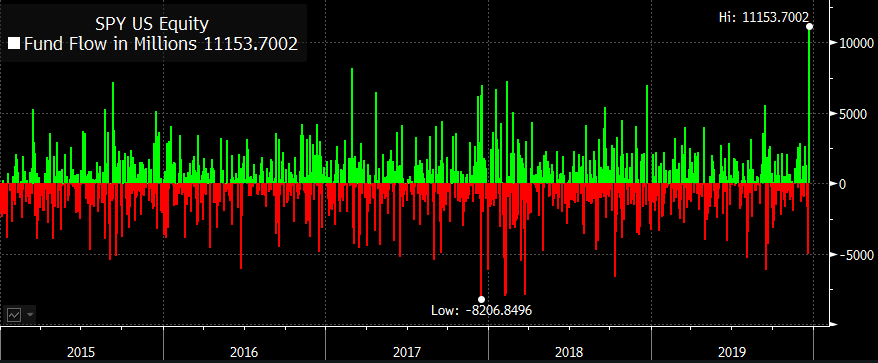
LARGE INFLOWS INTO SPY A CONTRARY INDICATOR
Eric B from Bloomberg posted this chart of a large inflow in the SPY on Friday. Maybe it was the rebalance or just people felt the need to get in now.
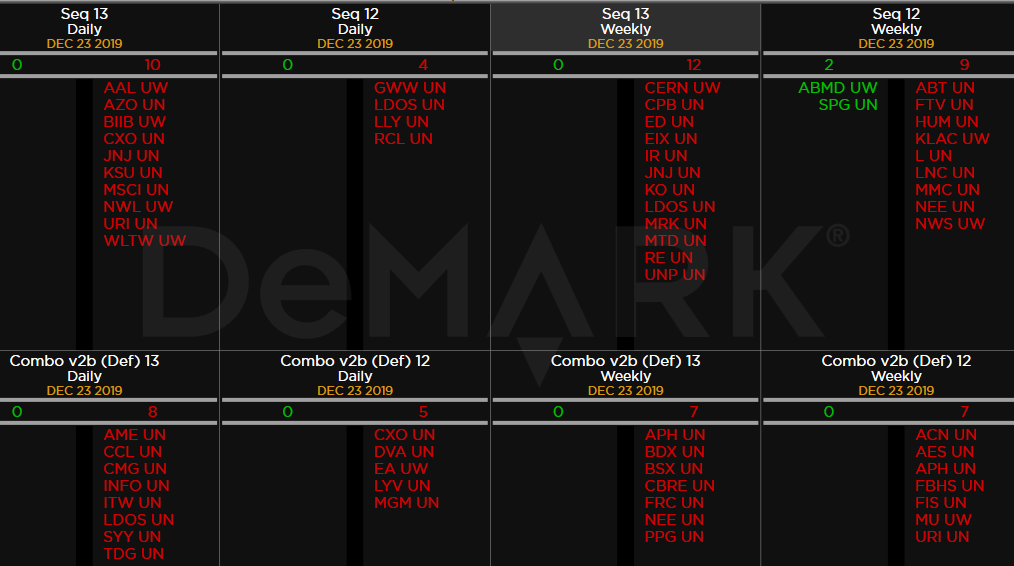
DEMARK OBSERVATIONS
Still only sell Countdown 13’s within the S&P Index. JNJ, by the way, has daily Sequential and Combo and weekly Sequential Countdown 13’s. CMG was added with the Combo 13 too
EUROPEAN INDEXES
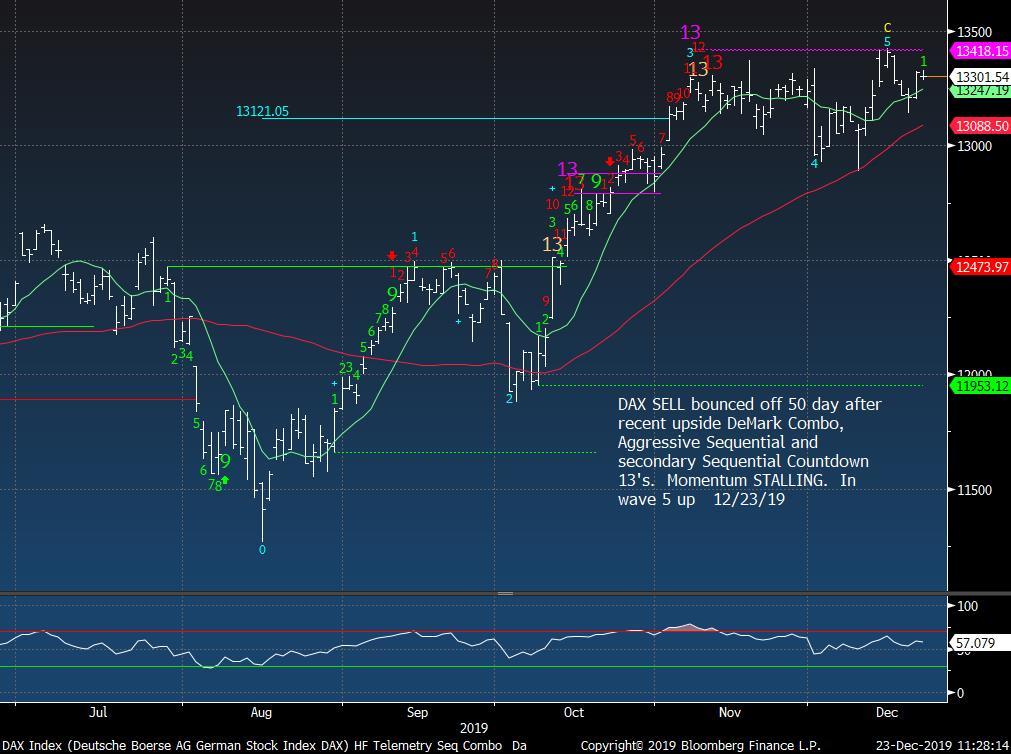
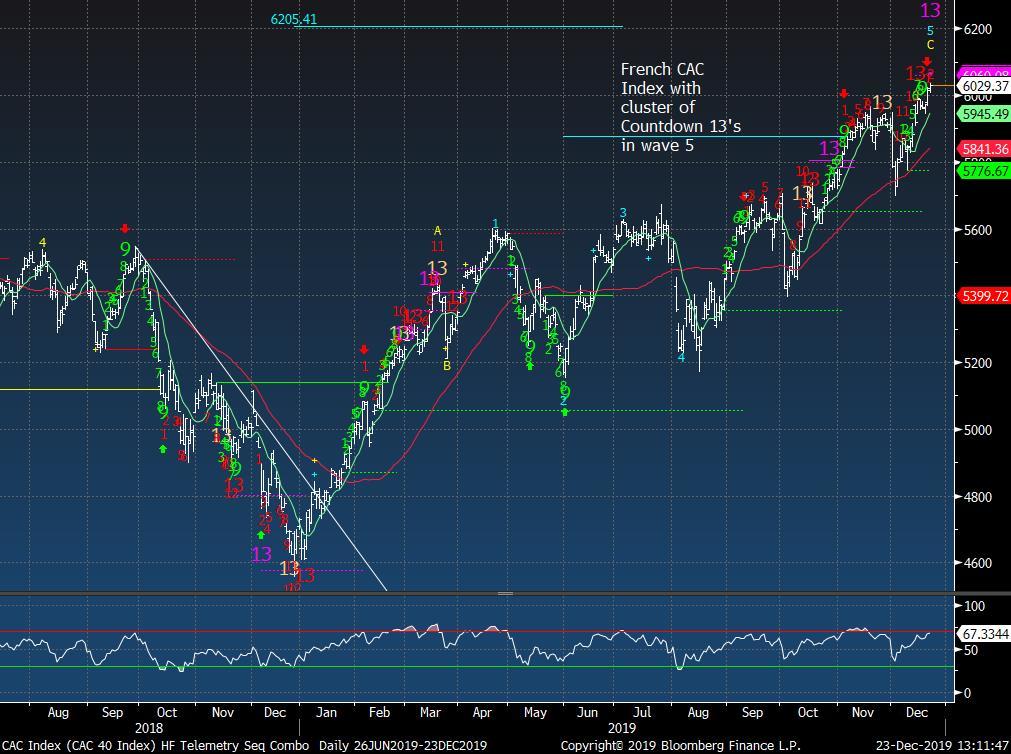
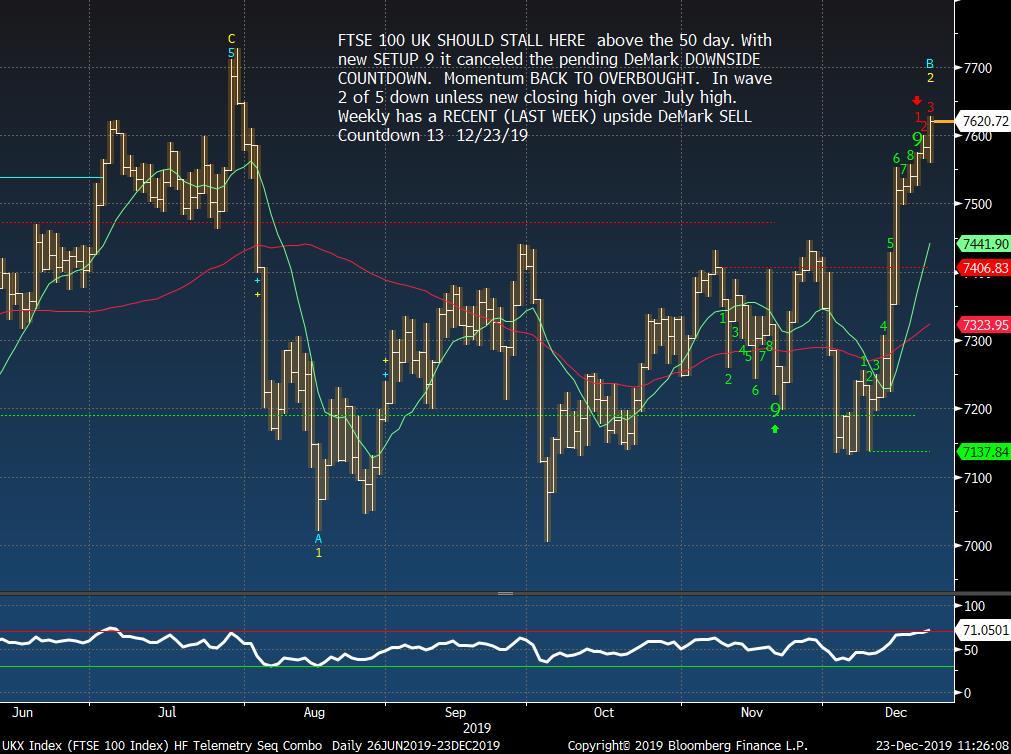
Europe is stretched in 5th and final upside wave

DAX going sideways since October
French CAC 40 index with new Countdown’s. A year ago I turned bullish on Europe with all the Countdown 13’s on the downside and with the trend line break to the upside
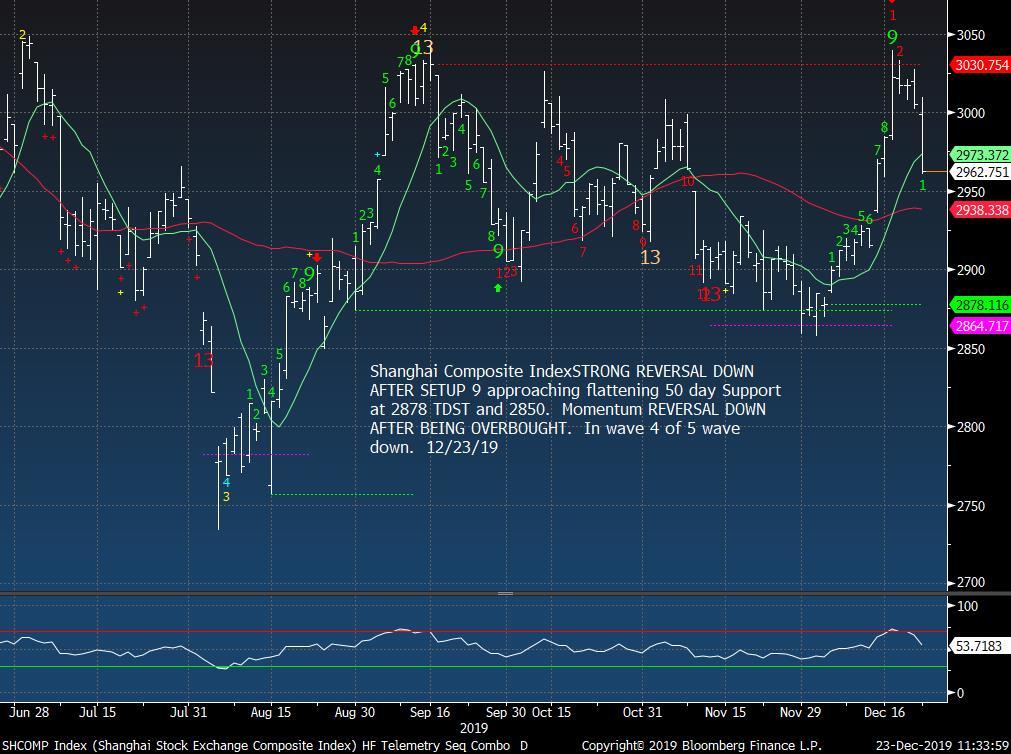
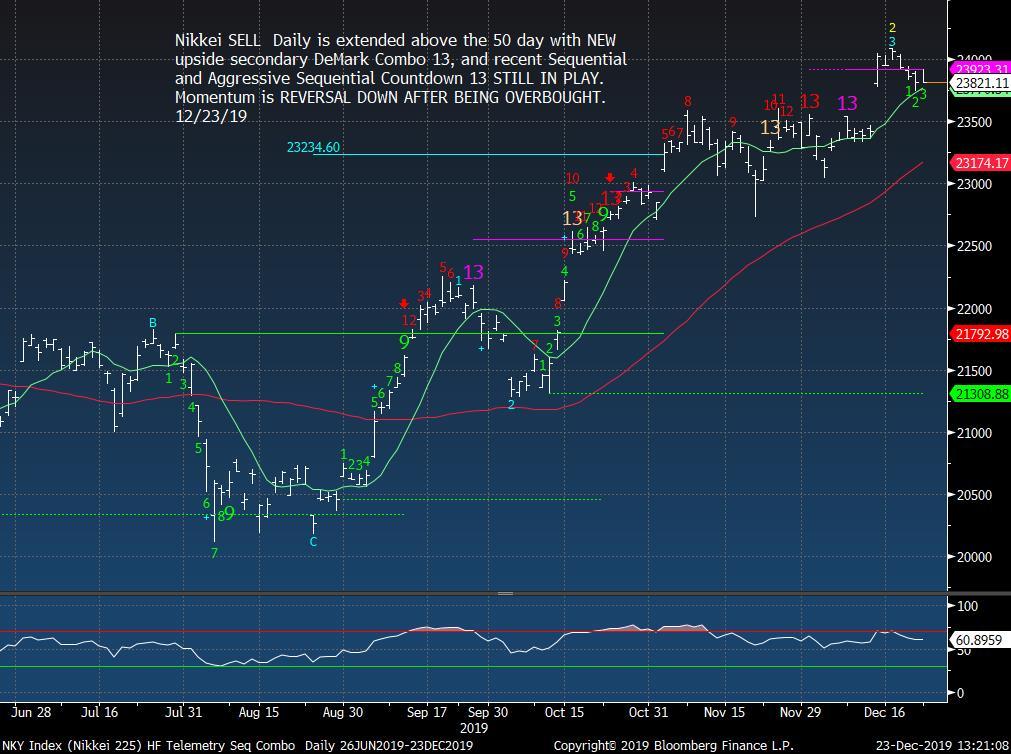
ASIAN INDEXES
Anyone notice what happened with the Shanghai Composite yesterday?

India’s Nifty 50 with upside Sequential Countdown 13 in play

CURRENCIES
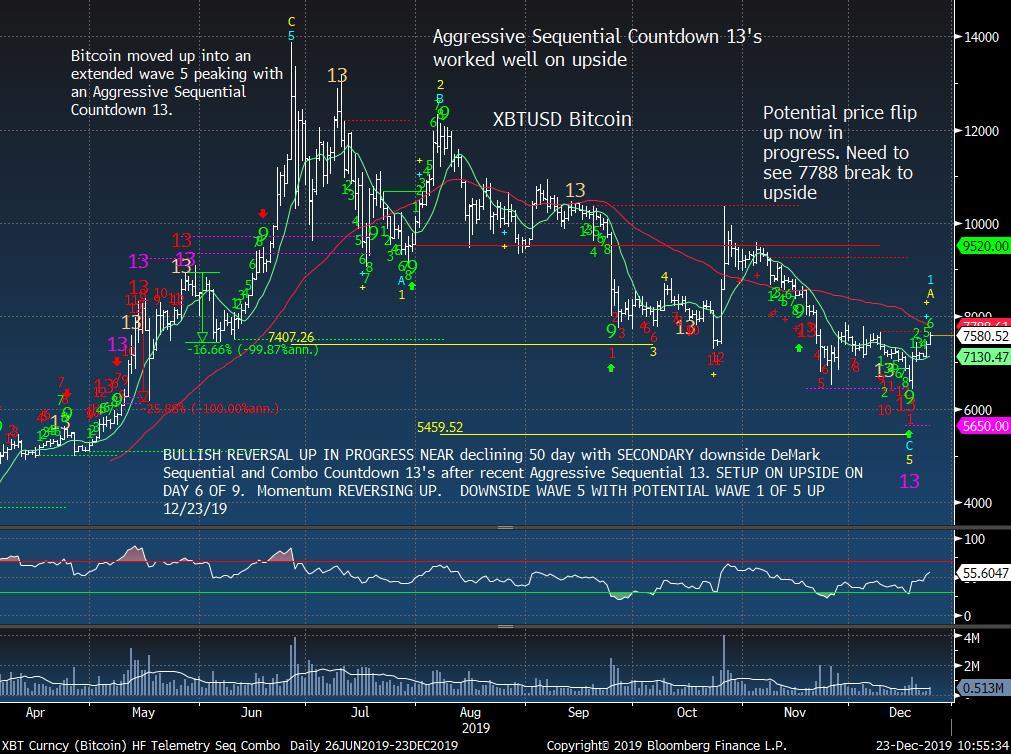
I’m still bullish with Bitcoin after the recent downside buy Countdown 13’s
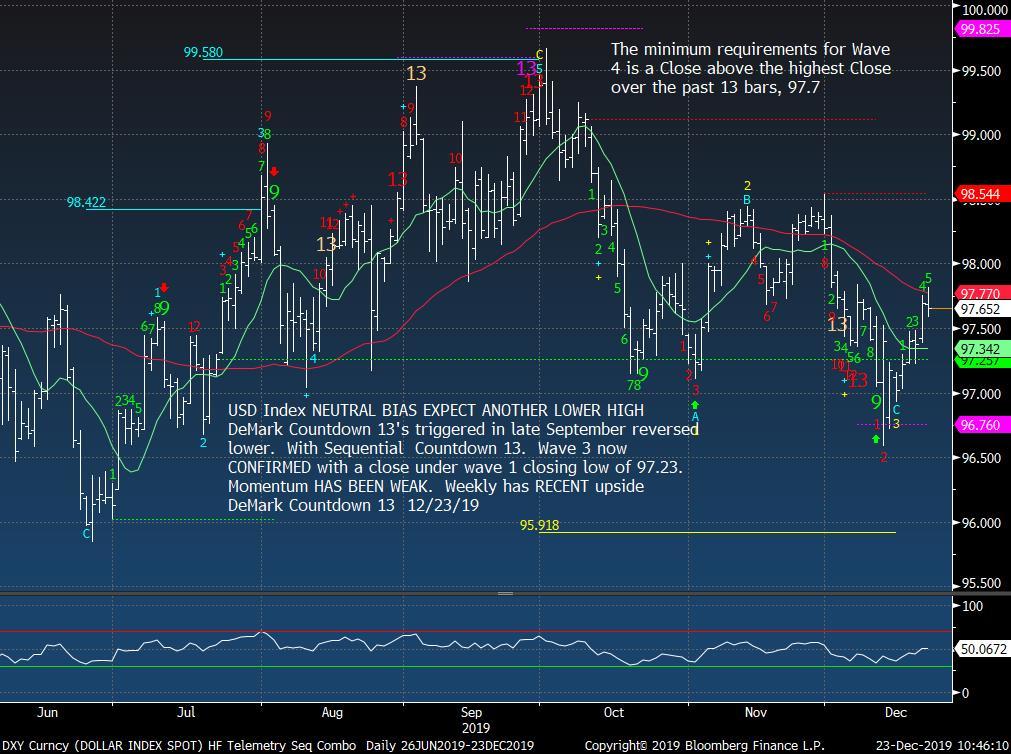
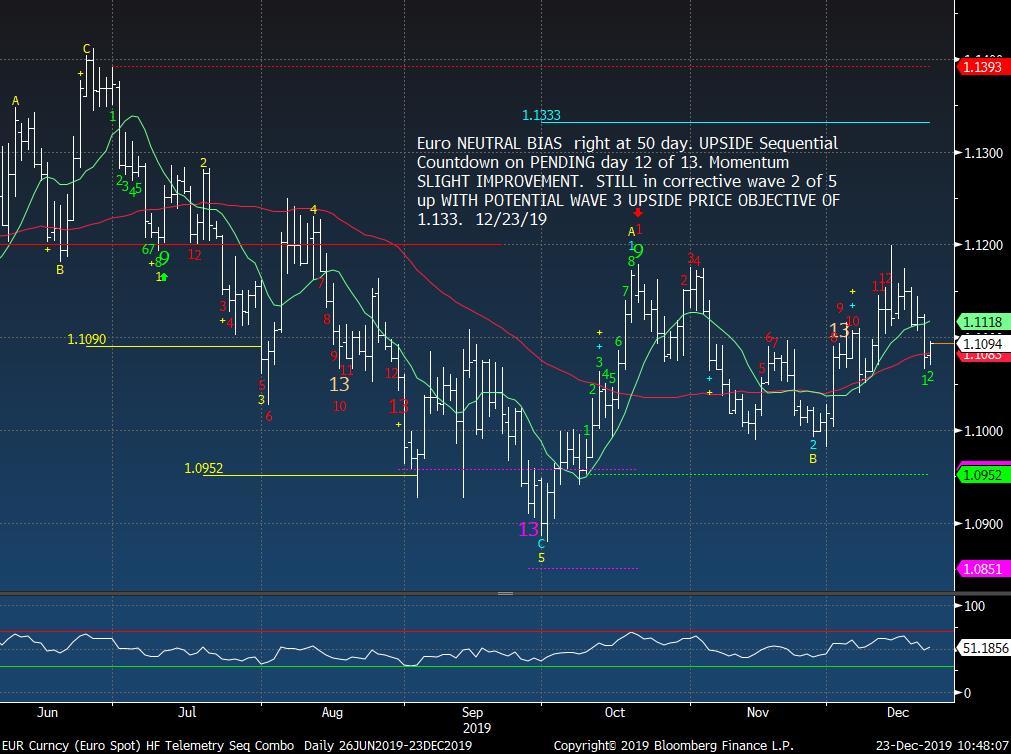
USD and Euro below continues to chop around and I have found a lot of people will get offsides quickly with this action
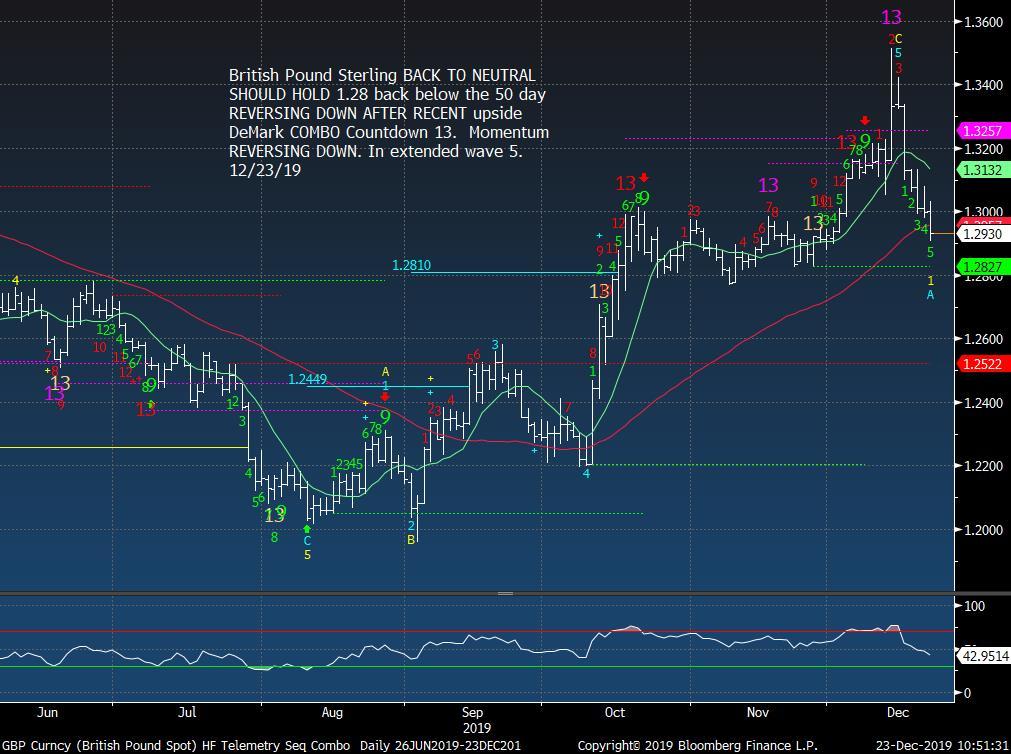
Sterling reversed down after the Combo 13. I recently moved on from the option trade I suggested on Bloomberg TV. Worked out well selling the 130/134 Jan 3 strangle for 1.50 buying back at .95 and .65
COMMODITIES
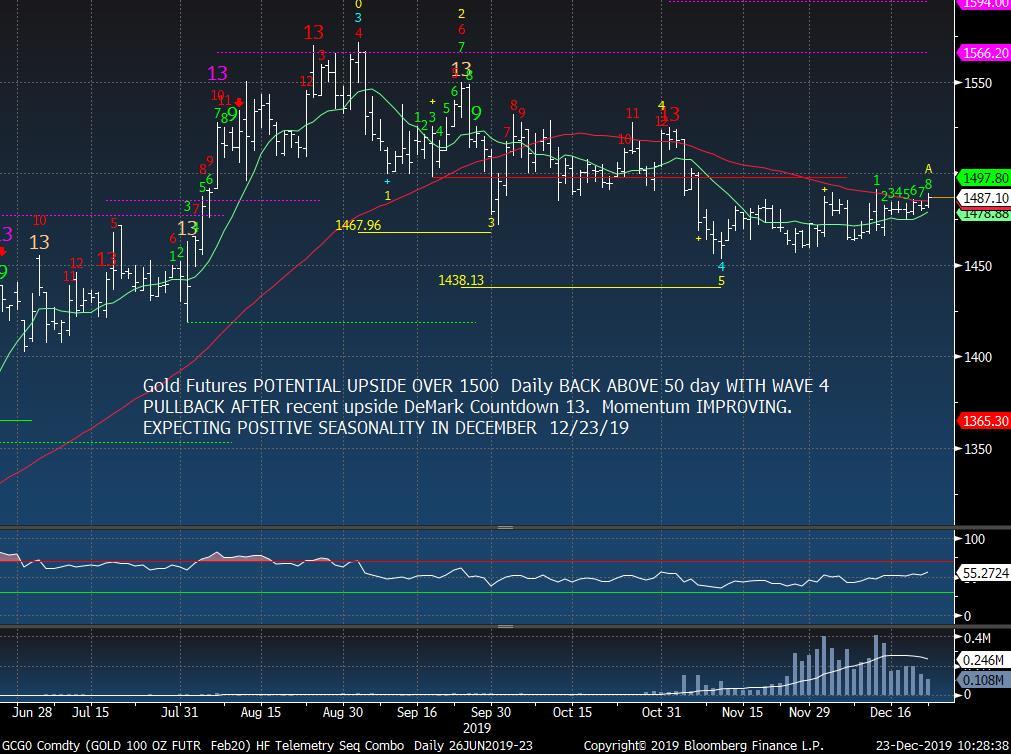
I still believe gold can lift from here
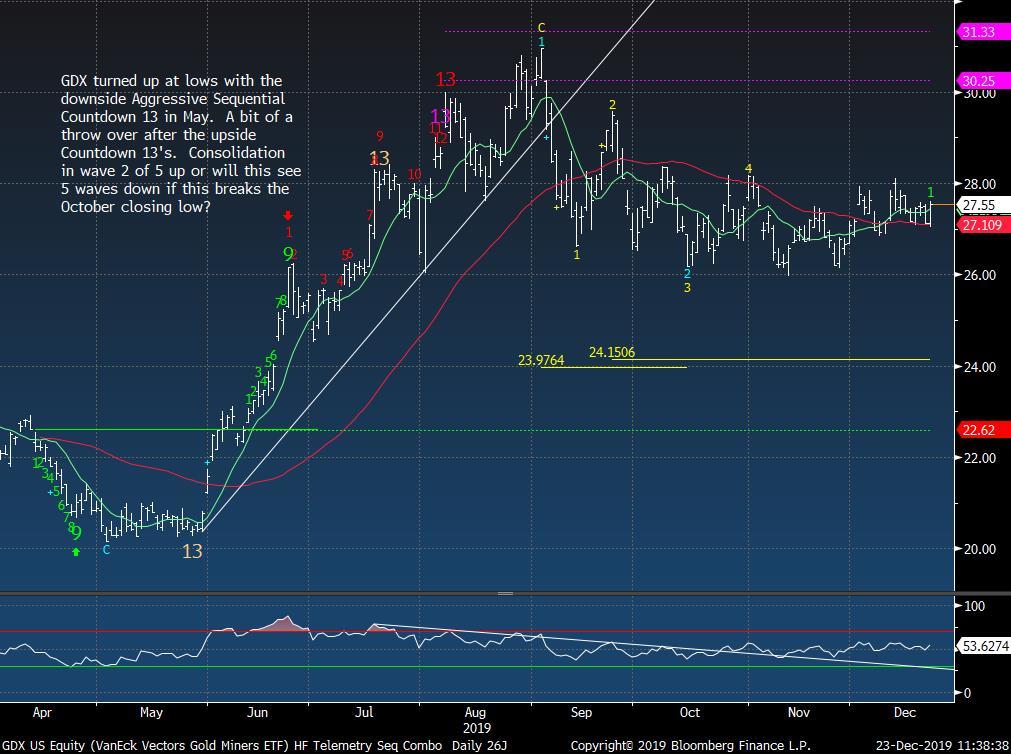
GDX which I don’t have a position on currently could move too
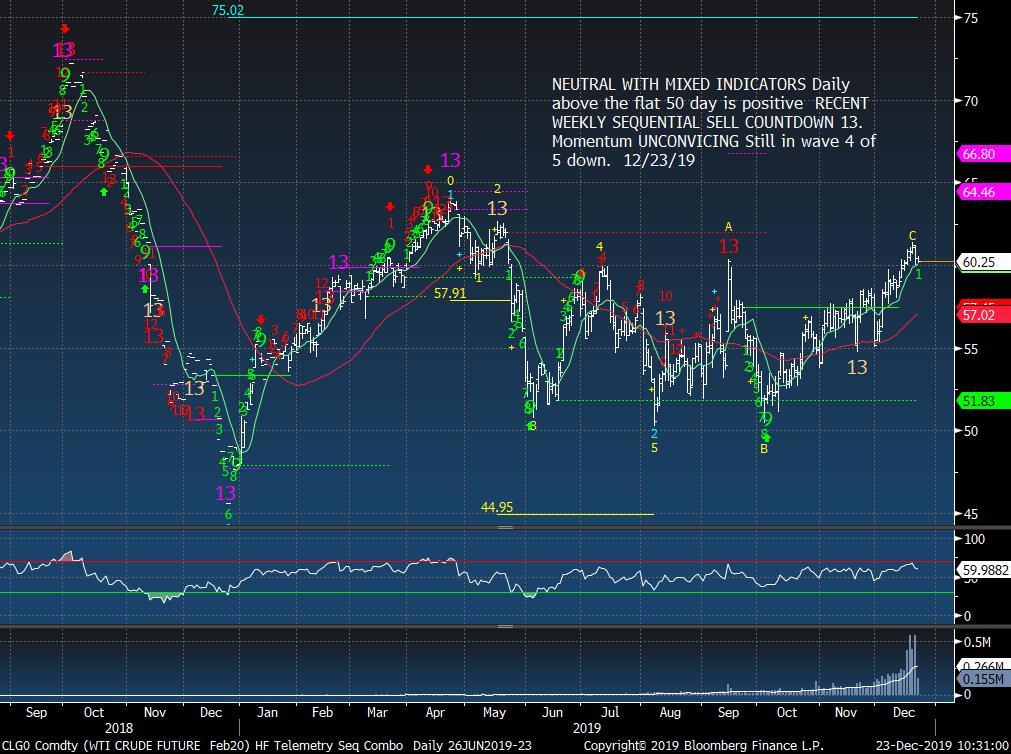
WTI Crude – still neutral although I like Energy sector stocks A LOT