by leecharles_
First of all, what is Implied Volatility and Historical Volatility?
Implied Volatility (IV) is how volatile the market expects a stock to be in the future over a year. IV is forward looking! For example, a stock price of $100 with an IV of 25% means the stock price could move $25 in either direction over the next year. IV indicates the annualized expected one standard deviation range for a stock price. This means there is a 68.2% chance (one standard deviation) the stock will move $25 up or down. IV is important because it represents the likelihood of an option pricing swinging in-the-money. The higher the IV, the higher the chance the stock can swing to in-the-money.
Now what is Historical Volatility? Historical Volatility is what the volatility actually was when looking back in time. Why would we care about historical volatility? Because it tells us if the market’s predictions about volatility (IV) was correct. Take a look at this chart of SPY, where implied volatility and historical volatility are graphed. You can see that the majority of the time, implied volatility is higher than historical volatility. This means the market thought volatility was going to be higher than what it really was.
What is Implied Volatility Percentile?
IV Percentile represents the percentage of days that implied volatility has traded below the current level over the past year.
For example, if IV Percentile is 5% in XYZ, that would mean that implied volatility only traded below current levels 5% of the time over the course of the previous 12 months. On the other hand, if IV Percentile in XYZ is 80%, that would mean that implied volatility had traded below current levels 80% of the time over the previous 12 months.
What is Implied Volatility Rank?
IV Rank tells us whether implied volatility is high or low in a specific underlying relative to the past year of implied volatility data.
For example, imagine that implied volatility has ranged between 30 and 60 for underlying XYZ over the past year. If implied volatility is currently trading at 45, then the IV Rank for XYZ would be 50% – exactly in the middle of its one-year historical range.
How do I take advantage of this?
You can use this to your advantage when selling options. You want to sell options when IV Percentile and/or IV Rank is really high (>75%). The reason we do this is because the current IV is historically much higher than what has been seen in the past, and is VERY likely to start going down in the future.
What if I’m long on an option but IV is starting to fall?
You can always hedge your position by going long on SVXY (inverse VIX) or by shorting VXX (Vix Near-Term Futures contracts. Here are some other volatility tickers that you can use to your advantage:
Long VIX
VXX – 1x leveraged short-term futures (1 month)
VIXY – short-term futures (1 month) TVIX – 2x short-term futures
UVXY – 1.5x leveraged front and second month futures
Short VIX
SVXY – 0.5x leverage inverse short-term futures
ZIV – 1x leverage inverse mid-term futures
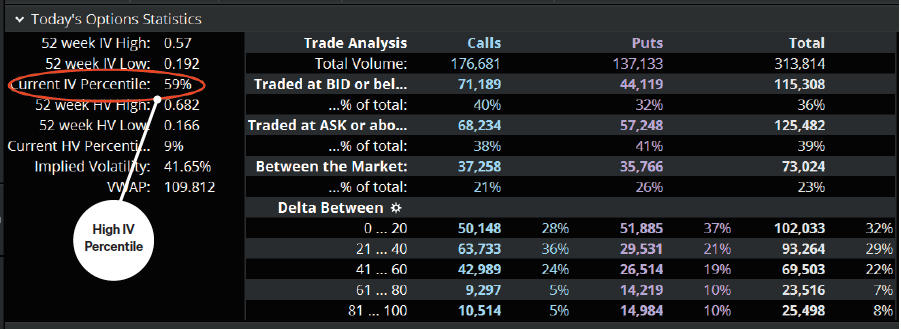
To my thinkorswim bros out there, you are able to see IV Percentile by going to Trade > All Products > Today’s Option Statistics. In order to view IV Rank on thinkorswim, you have to add your own custom study. To do that, visit this tutorial that tells you how. I’m not really sure why thinkorswim doesn’t display IV Rank. To my tastyworks bros out there, I’m pretty sure it displays both IV Percentile and IV Rank.
I hope some of you guys found this useful! Feel free to leave your criticisms/useful tips. 🙂
TL;DR Buy when IV Percentile and/or IV Rank is low and sell when IV Percentile and/or IV Rank is high.
Disclaimer: This information is only for educational purposes. Do not make any investment decisions based on the information in this article. Do you own due diligence.