Excerpted from John Hussman’s Weekly Market Comment,
There are three principal phases of a bull market: the first is represented by reviving confidence in the future of business; the second is the response of stock prices to the known improvement in corporate earnings, and the third is the period when speculation is rampant – a period when stocks are advanced on hopes and expectations.
There are three principal phases of a bear market: the first represents the abandonment of the hopes upon which stocks were purchased at inflated prices; the second reflects selling due to decreased business and earnings, and the third is caused by distress selling of sound securities, regardless of their value, by those who must find a cash market for at least a portion of their assets.
– Robert Rhea, The Dow Theory, 1932
Charles Dow once wrote, “To know values is to know the meaning of the market.” That quote may surprise trend-followers and adherents of technical analysis, because Dow’s work is often squeezed into a caricature focusing on nothing more than confirmation and divergence across the Dow Jones Industrial and Transportation averages. But Dow’s actual views, best elaborated by writers like Robert Rhea and William Peter Hamilton, were actually about something much more fundamental: identifying the position of the market in its complete bull-bear cycle. That’s a concept that investors have forgotten, encouraged by the illusion that the Federal Reserve’s buying of Treasury bonds is capable of saving the world from any form of discomfort. That illusion is likely to prove costly.
The recent bull market clocked in as the longest in history. Even if the September 20, 2018 peak in the S&P 500 was the final high, the preceding advance outlived the 1990-2000 bull market by nearly 8 weeks. Likewise, the current economic expansion is just 3 months shy of the record 10-year expansion that ended in early 2001, the unemployment rate is down to just 3.8%, the entire post-crisis gap between actual real GDP and the CBO estimate of potential real GDP has been eliminated, and the expansion has already outlived the previous runner-up, which ran from 1961 to the end of 1969.
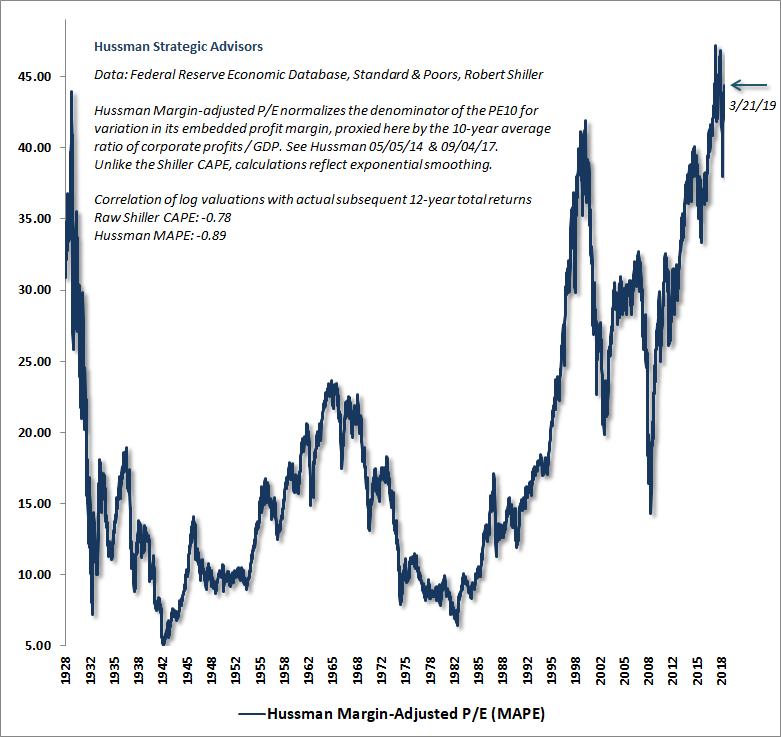
Meanwhile, based on the valuation measures we find best-correlated with actual subsequent market returns across history, the current market extreme already matches or exceeds those of the 1929 and 2000 peaks. There’s little question that the market is long into what Rhea described as the final phase of the bull market; “the period when speculation is rampant – a period when stocks are advanced on hopes and expectations.”
As I’ll detail below, the economic expansion we’ve observed since the 2009 economic low has been a rather standard mean-reverting recovery, with a trajectory no different than could have been projected on the basis of wholly non-monetary variables. The primary effect of extraordinary monetary policy wasn’t to drive real economic gains, but instead to amplify speculation and contribute to wealth and income disparities. Wages and salaries as a share of GDP are clawing higher from the historic low set in 2011, but have only begun to erode the elevated profit margins on which Wall Street is basing its permanent hopes and expectations.
Aside from historic extremes in the valuation measures best correlated with actual subsequent market returns, one measure of these hopes and expectations is that in 2018, according to the Financial Times, 81% of U.S. companies that went public reported losses in the 12 months before their initial public offerings, matching the high-water mark set at the height of the dotcom bubble (h/t Hadi Taheri). It’s the same kind of spectacle that Rhea described nearly a century ago, when he wrote:
“Worthless equities were being sky-rocketed without regard for intrinsic worth or earning power. The whole country appeared insane on the subject of stock speculation. Veteran traders look back at those months and wonder how they could have become so inoculated with the ‘new era’ views as to have been caught in the inevitable crash. Bankers whose good sense might have saved the situation, had speculators listened to them, were shouted down as deconstructionists, while other bankers, whose names will go down in history as ‘racketeers,’ were praised as supermen.”
Still, while it was important to Dow, Rhea, and Hamilton to understand valuations, and to recognize the position of the market in the cycle, they were also carefully focused on the behavior of prices, particularly the uniformity of behavior between their primary indices of interest – the Dow Industrials and Transports. While our own measures of market internals focus on the uniformity of a much broader set of securities, it’s enormously instructive to consider several critical features of market behavior that they understood even a century ago.
- First, market fluctuations exhibit cycles that move between periods of extreme optimism and periods of profound despair.
- Second, the extremes of each cycle are characterized by unusually elevated or depressed valuations, and these valuations comprise the true “meaning” of the market for investors.
- Third, the speculative pressure toward higher prices, and the downward pressure toward lower prices, can be largely gauged by the “uniformity” of behavior across various groups of securities.
- Fourth, it is enough to identify prevailing conditions and respond to them as they change, without any need to predict the extent or duration of a subsequent market movement.
Consider the situation in mid-1929, when, as the market pushed to obscenely rich valuations, Hamilton acknowledged the uniform behavior of the Dow averages, while also carefully placing the advance in a full-cycle context. That uniformity suggested that investors had taken the speculative bit in their teeth, despite the fact that the bull market, in hindsight, would reach its peak only a few weeks later.
“It goes without saying that the stock market, which has advanced with merely secondary reactions for five years and eight months, is almost necessarily in the third or last stage of such a movement, where stocks do not carry themselves on the dividend return, for the most part, and where sanguine expectations of the future exercise a greater influence than immediate results. All that the averages say when they give such a bull point as that of June 29 [when the Dow averages breached their previous May highs] is that stocks are due for a further advance. They do not predict the extent of that advance.”
The 1929 peak occurred on September 3rd of that year, followed immediately by a steep, waterfall decline. Hamilton’s confirmation of a “turn in the tide” was published the next month, on October 25, 1929, the Friday before Black Monday. By then, the Dow was already 20% off its high (that’s what safety nets and tail-risk hedges are for). The Dow would lose an additional 86% before setting its final low in 1932.
We presently have a financially disfigured economic expansion that’s three months shy of the longest in history, where the unemployment rate is down to 3.8%, and the most reliable measures of stock market valuation again rival the hypervalued extremes of 1929 and 2000. In this context, to call for an immediate 50 basis point rate cut and a resumption of quantitative easing from the Fed seems a frantic strategy to keep a hypervalued market and two-tiered economic “prosperity” in suspended animation.
In a hypervalued market, we do not need to embrace market risk as a result of speculative pressures, but we have to defer an overtly bearish investment outlook on immediate market direction. All of this effort to jam the speculative bit back into the horse’s teeth requires us to adopt a rather neutral outlook here, until we observe fresh deterioration in market internals. Given the late-stage condition of the financial markets and the economy, my sense is that, as in 1929, they may just run this poor horse straight up and over the cliff.
We’ll respond to shifts in valuations and market action as they emerge, so forecasts aren’t actually necessary. Still, full-cycle risks have a way of emerging in ways that investors wholly rule out at market peaks. Glorious half-cycle market advances leave investors vulnerable to catastrophe, because investors hold contempt for anyone who suggests there may be a cliff on the other side of the mountain.
Still, recall that I openly anticipated the 2000-2002 collapse (which wiped out the entire total return of the S&P 500 – over and above T-bill returns – all the way back to May 1996), estimated an -83% loss in tech stocks at their March 2000 peak (which rather improbably matched the actual loss of the tech-heavy Nasdaq 100), and, after a constructive shift in early 2003, projected the 2007-2009 collapse (which wiped out the entire total return of both preceding bubbles – over and above T-bill returns – all the way back to June 1995). The distressing thing is that, from a historical perspective, all of those losses were rather run-of-the-mill cycle completions.
Understanding potential downside risk at a market extreme has a way of concentrating the mind. If I were to offer a guess, I’d suggest that regardless of whether the S&P 500 registers fresh near-term highs, investors should allow for the S&P 500 to be perhaps -30% lower by the end of 2019, on the way to losing an additional -50% of its remaining value over the rest of the down-cycle. That, after all, is how a market loses -65% of its paper value. That’s not so much a forecast as a base case. A -65% loss, unfortunately, would presently represent a run-of-the-mill cycle completion from current valuation extremes. As I observed at the 2000 peak, “If you understand valuations and market history, you know we’re not joking.”
… the investors at greatest risk in the coming years will likely be those who take solace from Fed easing in environments where valuations are extreme yet investors are inclined toward risk-aversion. It will be necessary to refrain from too negative an outlook when overvaluation is joined by speculative psychology, and also to refrain from too aggressive an outlook when reasonable valuations are still joined by extreme risk-aversion. In any event, I expect that responding systematically to valuations and market action, particularly the condition of market internals, will be sufficient to navigate whatever policy makers throw at the markets.