Crude oil’s plunge continued on Tuesday due to fears of a growing glut and economic slowdown. West Texas Intermediate crude oil fell 7.3% to $46.24 a barrel, while Brent crude oil fell 5.6% to $56.26 a barrel. Crude oil’s ongoing bear market confirms the warning I published on November 6th called “Is A Crude Oil Liquidation Event Ahead?”
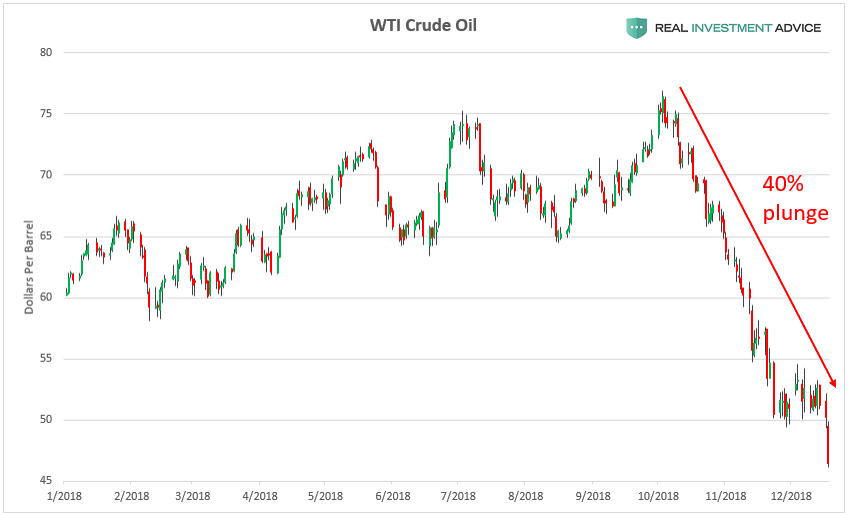
After today’s drop, West Texas Intermediate crude oil is down approximately 40% since early-October:
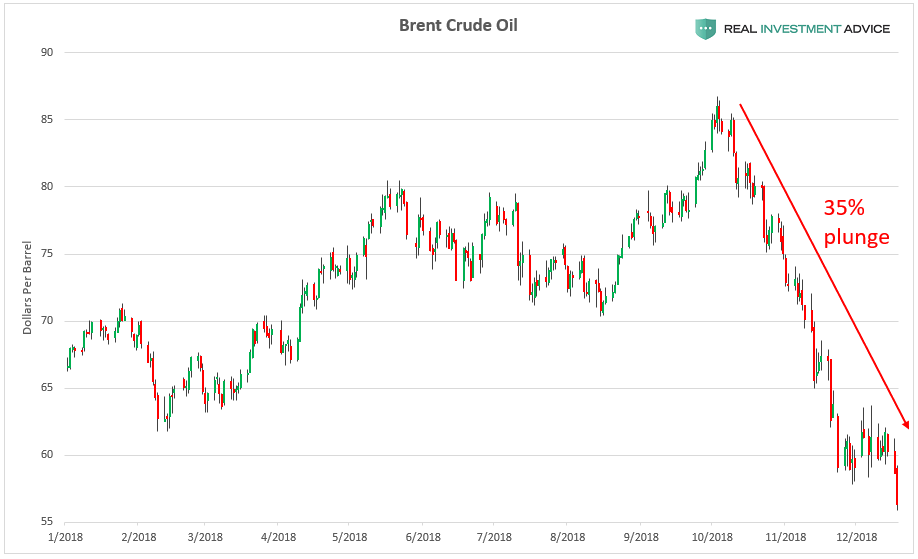
Brent crude oil is down approximately 35% since early-October:
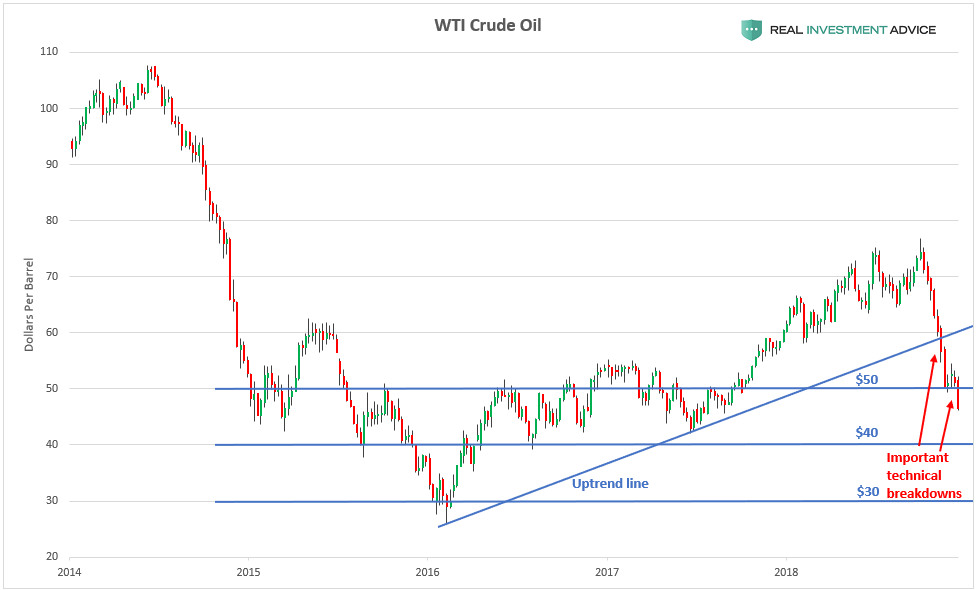
In recent weeks, WTI crude oil broke below its uptrend line that started in early-2016 and the key $50 level, both of which are important technical breakdowns. The next price targets to watch are $40, then $30, and so on.
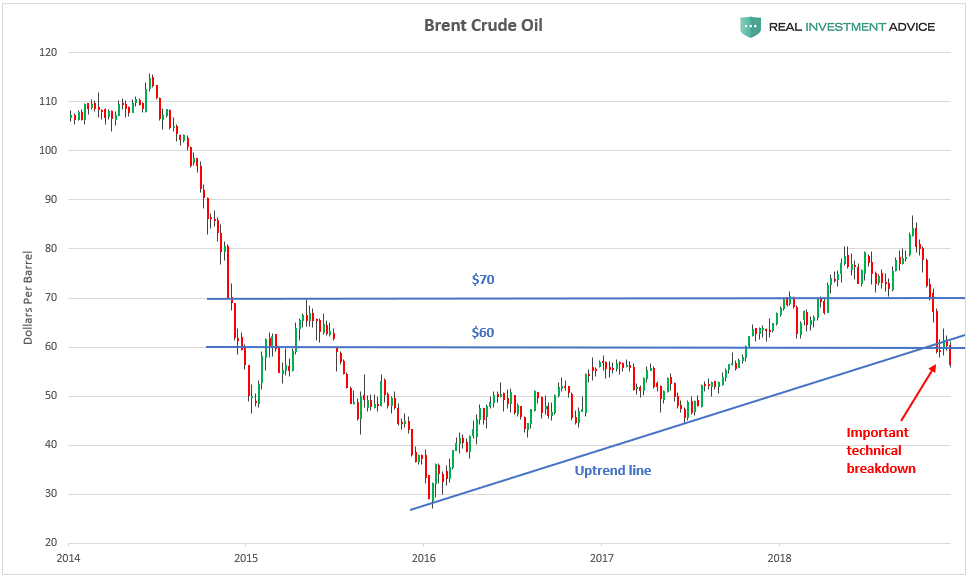
Brent crude oil recently broke below both its uptrend line and its key $60 level, which is a bearish omen that puts $50, $40, and $30 into play as the next price targets/support levels to watch.
As I discussed a few weeks ago, crude oil is plunging because it is pricing in much slower economic growth and a likely recession, as well as growing inventories. I am particularly worried about plunging oil prices because I believe that it is going to pop the shale energy bubble that I have been warning about for years.
Here’s what I wrote in Forbes in 2014:
I am also growing increasingly concerned that the U.S. shale energy boom is actually another post-2009 economic bubble (it would be a part of the commodities bubble). In a zero-percent interest rate environment like we are currently experiencing, any economic boom can devolve into a bubble. Shale energy extraction is a very capital-intensive business that relies heavily on cheap credit to survive. Shale oil wells experience much faster decline rates than conventional oil wells, which means that energy companies must keep drilling at a furious pace just to maintain their production – a very costly proposition that is typically funded by copious amounts of debt.
Here’s what I wrote in Forbes in September 2018, when I summarized the shale energy bubble:
U.S. shale energy boom/energy junk bonds: This boom/bubble is closely related to the corporate debt bubble discussed above. Extracting oil and gas from shale via fracking is extremely capital-intensive and would not be feasible in a normal interest rate environment. Thanks to the artificially low interest rate environment since the Great Recession, the shale energy industry’s net debt surged to $200 billion in 2015 – a 300% increase from 2005. Rising interest rates and the bursting of the corporate debt/junk bond bubble will cause a major bust in the shale energy industry.
The oil price plunge and overall rising interest rate environment is causing high yield or “junk” bonds to sink. The chart below shows that the HYG high yield corporate bond ETF recently broke below a key technical level known as a neckline, which is a signal that further bearish action is likely ahead (which means that junk bond yields will rise). I believe that this is yet another sign that the shale energy bubble is at risk of popping.
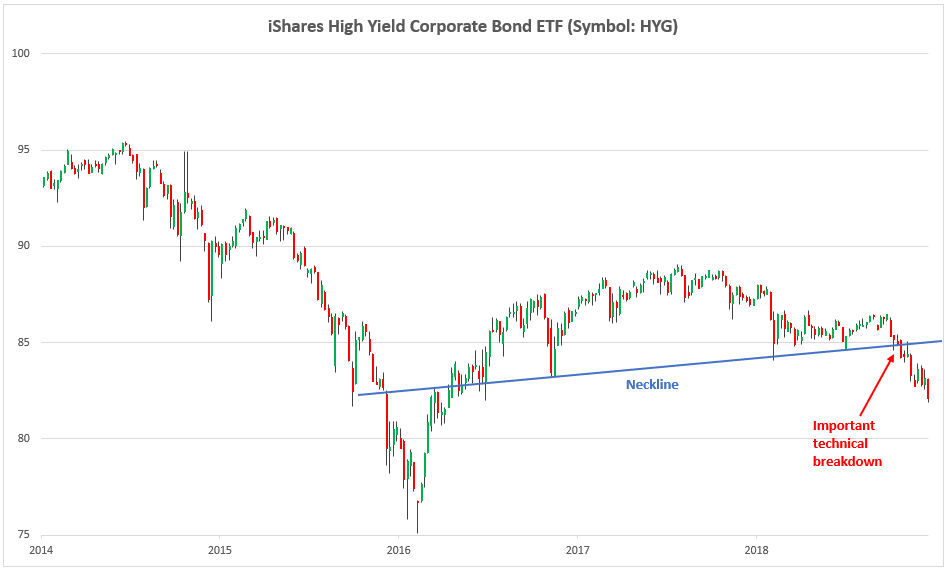
For now, I am watching $40 and $50 a barrel as the next price targets in WTI and Brent crude oil. The HYG high yield corporate bond ETF is likely to gun for its early-2016 lows in the course of this energy bust.