Wolf Richter wolfstreet.com, http://www.amazon.com/author/wolfrichter
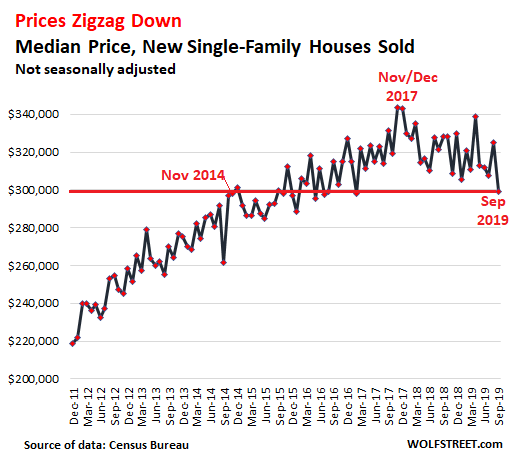
The median price of new single-family houses in September fell 8.8% from a year ago to $299,400 – down 12.8% from the peak in November and December 2017 and back where the median price had first been in November 2014, according to the Commerce Department this morning:

“Median price” means half of the houses sold for more, and half sold for less. The decline in the median price does not include incentives that are thrown in by homebuilders to close deals, such as free granite counter tops.
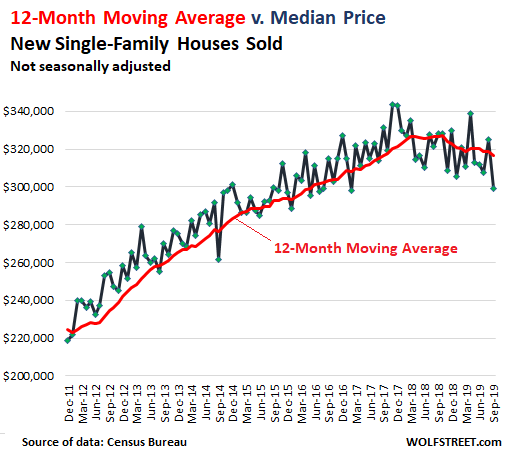
The longer-term trend via the 12-month moving average.
This median-price data – produced jointly by the Census Bureau and the Department of Housing and Urban Development – is “volatile” on a month-to-month basis. To show the longer-term trend, I added the 12-month moving average, which eliminates the monthly ups and downs. The September data point, being the average of the past 12 months, lags months behind of today’s market, but it allows for longer-term trends to become clearer.
The lag of the 12-month moving average (red line) shows up in how, on the way up, median prices were mostly above the red line, and now on the way down, median prices are mostly below it:
So the market has significantly changed, and homebuilders are responding to this changed market with lower prices – which is interesting given where mortgage rates are.
Mortgage rates tick up but remain near record lows.
The average 30-year fixed-rate mortgage interest rate rose to 3.75% for the week , according to Freddie Mac this morning. While up a tad from the near-record lows in August, it is still down over a full percentage point from 4.9% a year ago and remains close to record lows, which puts the decline of new house prices into a peculiar light as it was assumed that such a sharp drop in mortgage rates, as we’ve seen since last November, would boost house prices:

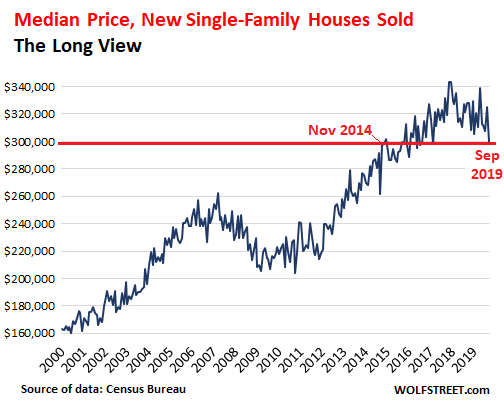
The Long View.
During Housing Bust 1, the median price of new houses dropped 22% from the peak in March 2007 to the bottom in March 2009. Then, from 2011 and 2012 through the peak in November 2017, it surged by about 55% to top out 31% above the peak of Housing Bubble 1. But at the end of 2017, it hit a ceiling and has since then dropped nearly 13%.
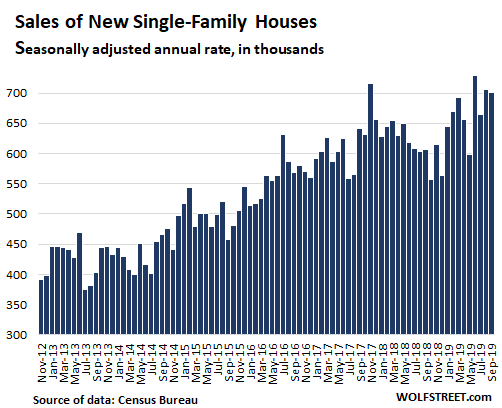
Lower prices beget sales.
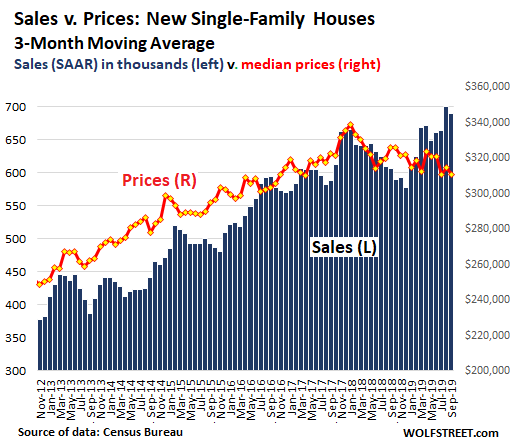
Homebuilders – unlike homeowners who want to sell – cannot “outwait the market.” They have to move their speculative inventory, and to stay in business, they have to build and sell houses. The lower prices are stimulating volume. In September, homebuilders sold new houses at a seasonally adjusted annual rate of 701,000 houses, the fourth highest since the Housing Bust, and up 15.5% from September last year:
The relationship between prices and sales volume – how they behaved before 2018, and how they changed over the past couple of years – becomes clearer with a comparison of the three-month moving averages of median price and sales (median price = red line, right scale; sales volume = blue columns, left scale). The sharp drop in sales that started in early 2018 was eventually stopped and then reversed by significantly lower prices:
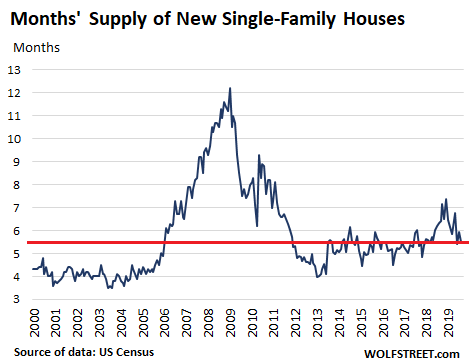
Plenty of Supply.
Inventory of new houses for sale ticked down to a seasonally adjusted annual rate of 321,000 houses. This is still high. But due to the increase in sales, home builders are now sitting on 5.6 months’ supply at the current rate of sales, down from the range between 6 and 7 months late last year and earlier this year. Four months’ supply would be more than enough:
Homebuilders are the pros in the housing market. They have no illusions – unlike homeowners. They have to adjust to the market so that they can continue to build and sell houses at a profit. They cannot build speculative houses and sit on that inventory for long. They have to do what it takes to move it. And they’re doing it.
The median price is impacted by cutting prices and by a change of mix. If homebuilders sell a larger number of lower-priced homes, the median price declines – because builders chose to build houses at lower price points to begin with to meet the market; and because they cut prices of houses they’d intended to sell at higher price points. One way or the other, it shows that on average, as an industry, builders have run into price resistance in enough areas to push down the national median price, despite the ultra-low mortgage rates.
In the San Francisco Bay Area, house prices dropped 16% from the peak in May 2018. Ironically, they dropped the most in Silicon Valley. Read... Housing Bubble in Silicon Valley & San Francisco Bay Area Turns to Bust Despite Low Mortgage Rates & Startup Millionaires