The US index of Leading Economic Indicators slumped by the most in over 40 months.
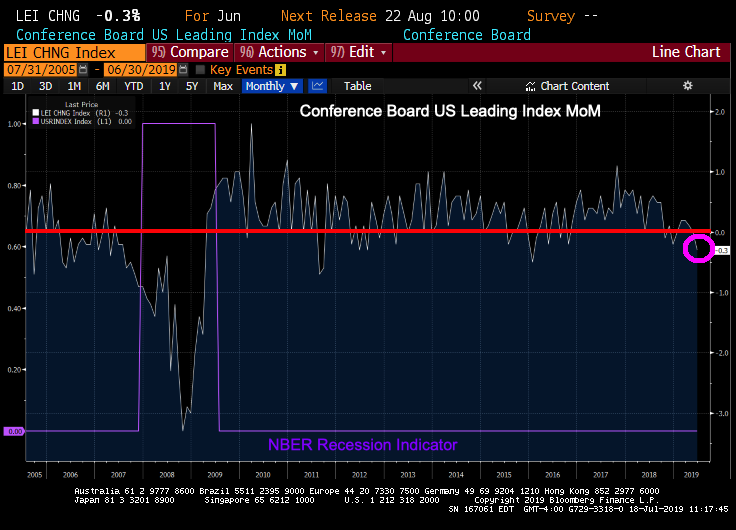
On the other hand, the index was negative MoM sixteen times after January 2019, yet there was no recession. So this is likely a false risk flag.
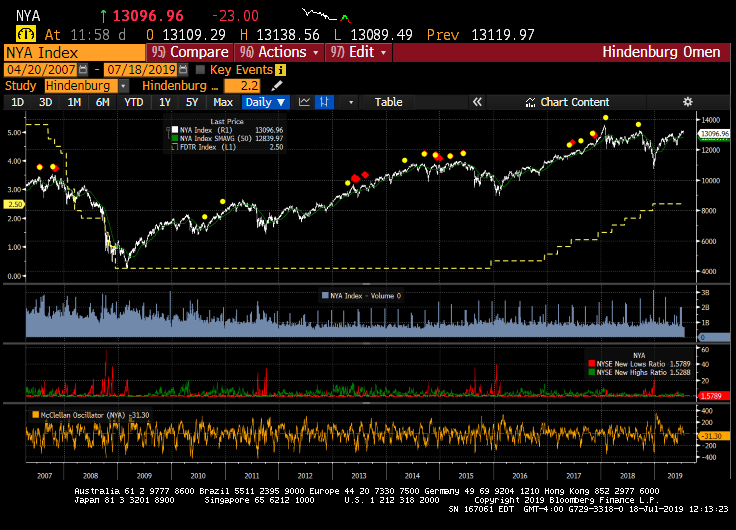
If you believe technical indicators like the Hindenburg Omen, the HO is not flashing any warning.
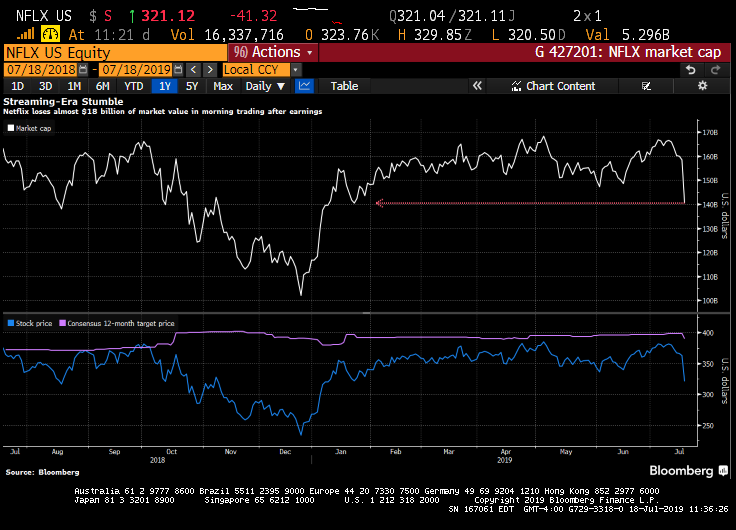
Netflix, my favorite streaming service for The Office with Rainn Wilson (aka, Dwight Shrute) and Parks & Recreation with Nick Offerman (aka, Ron Swanson) tumbled mightily with a bad earnings report. But a bad earnings report is not necessarily indicative of an impending recession.
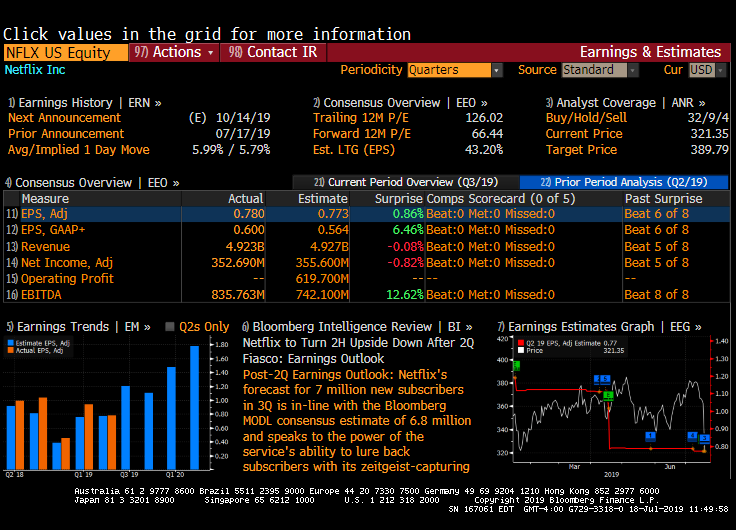
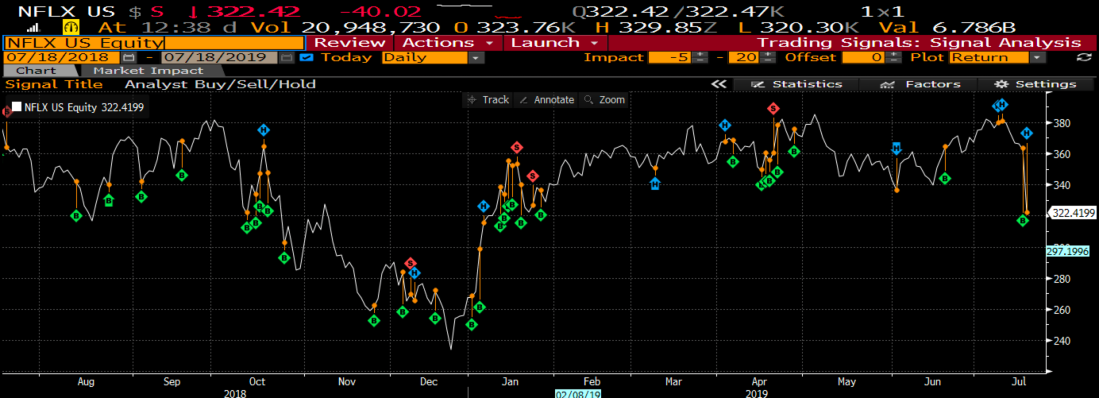
Netflix Inc. had lost about $18 billion, or 11%, of its market capitalization as of 10:55 a.m. Thursday in New York trading. The streaming-video giant fell the most in a year on an intraday basis after reporting the loss of 130,000 U.S. customers and slower growth overseas last quarter. While the company has yet to lose any of its buy ratings as a result, analysts trimmed their 12-month price targets to a consensus $389.79 a share versus $398.14 prior to Wednesday’s earnings report.
But, Netflix’s decline in earnings per share occurred back in April, so it was expected.
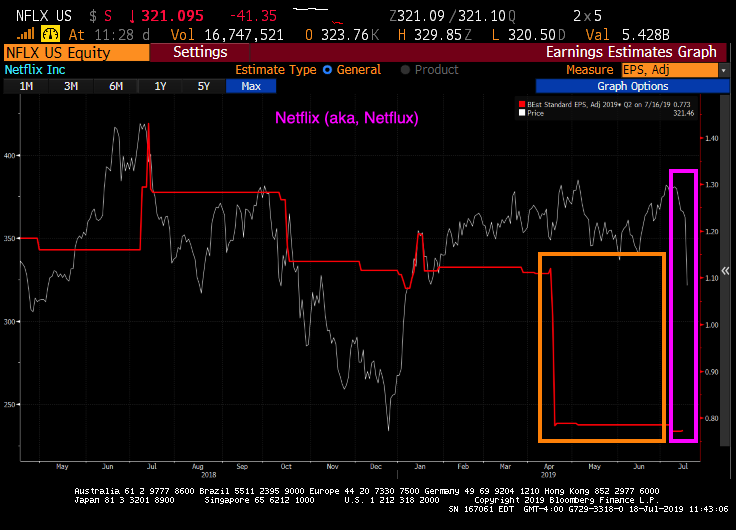
In fact, Netflix has a modest earnings surprise.
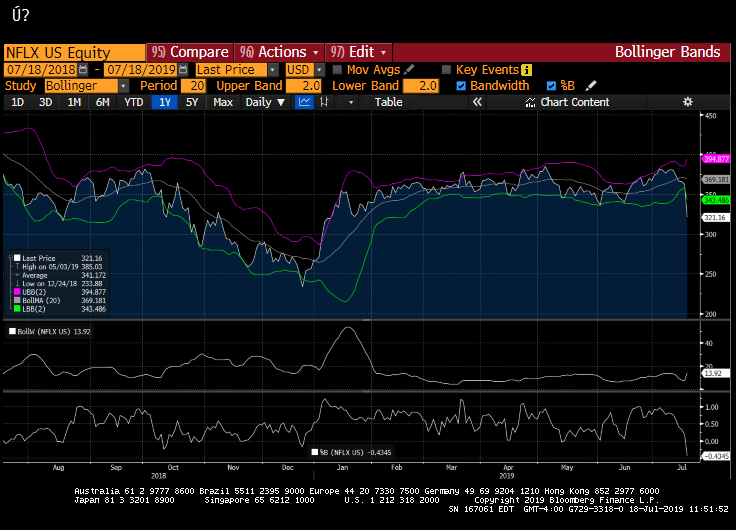
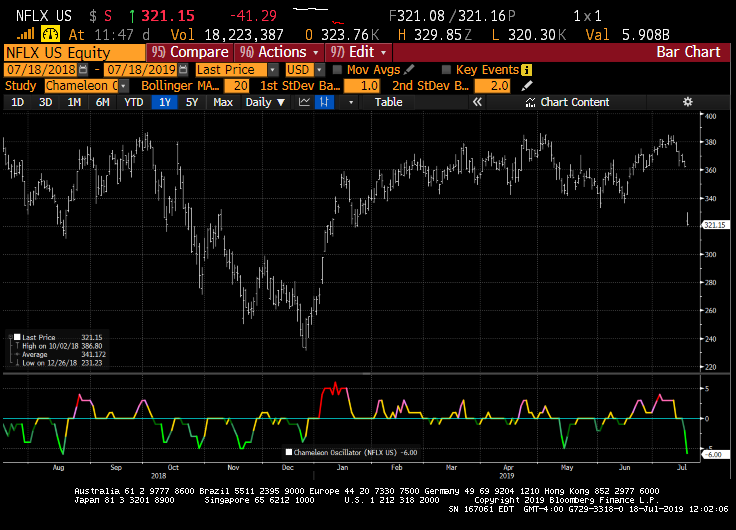
Bollinger Band, a technical indicator, didn’t pick up on the decline in Netflix stock price.
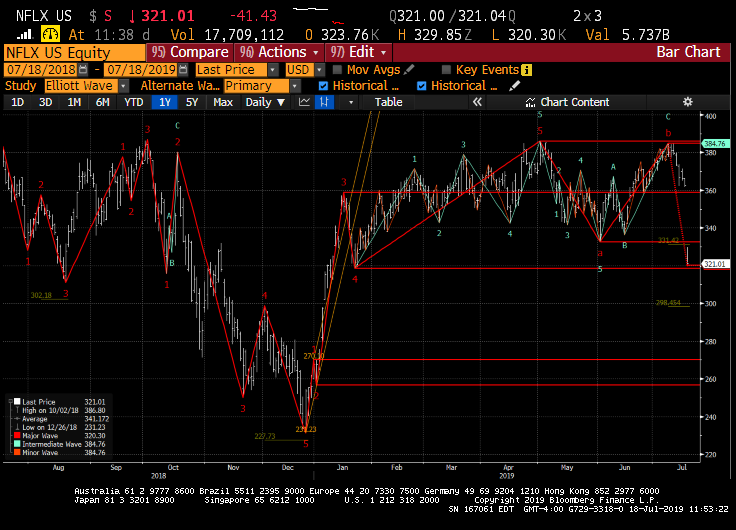
Elliott waves? Looks more like a tsunami.
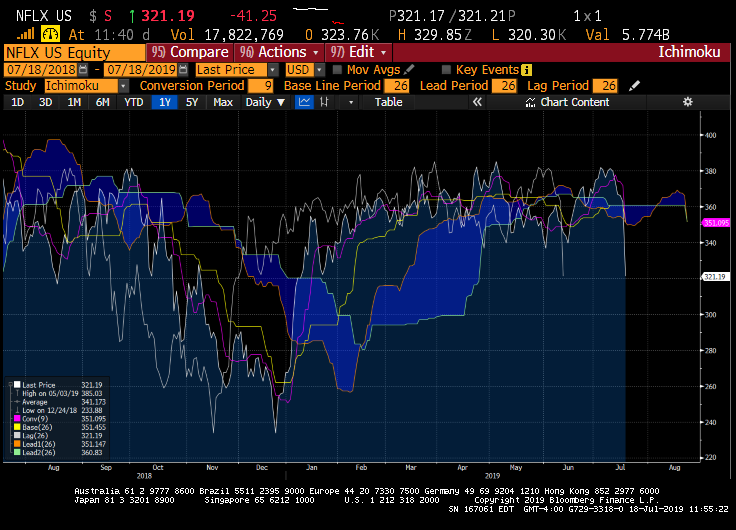
And Netflix stock price is currently below the Ichimoku cloud.
The Chameleon Oscillator is … green.
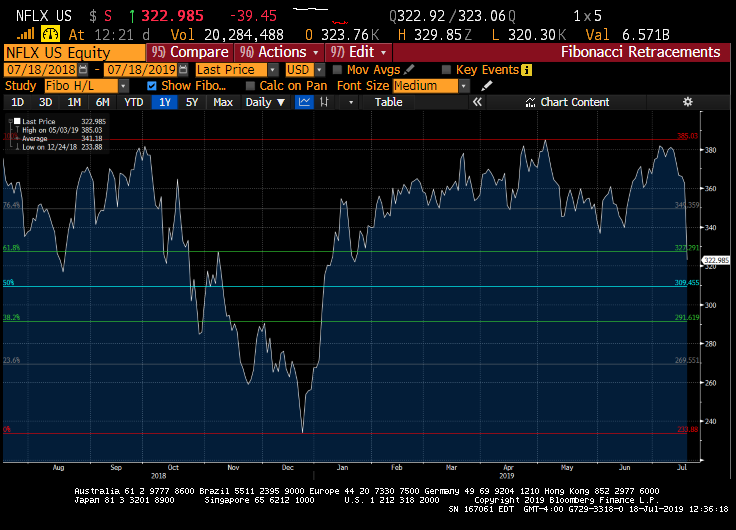
Fibonacci retracement? Netflix is definitely retracing!
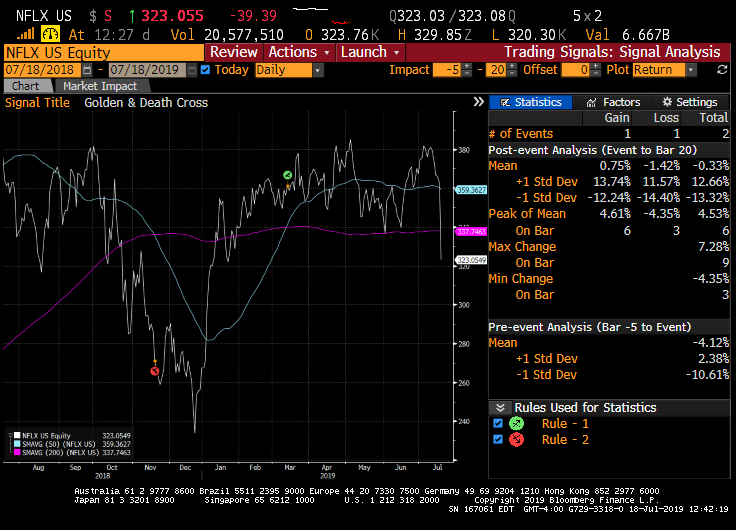
Is Netflix at a golden cross? A golden cross is a technical chart pattern indicating the potential for a major rally. The golden cross appears on a chart when a stock’s short-term moving average crosses above its long-term moving average. The golden cross can be contrasted with a death cross indicating a bearish price movement.
Or is Netflix below a death cross? Not yet. A death cross appears on a chart when a stock’s short-term moving average crosses below its long-term moving average. Typically, the most common moving averages used in this pattern are the 50-day and 200-day moving averages. … An increase in volume typically accompanies the appearance of the death cross.
So, in this case, technical analysis gave an inaccurate buy recommendation. But true technical believers will now interpret the charts as a buy signal!
But analysts are saying “Buy” after Netflix’s plunge.
Netflix is losing The Office and likely Parks and Recreation to NBC Universal streaming service. And then there is Amazon Streaming, Disney, … a crowded market place.
So, the robot in “Lost in Space” may be giving a false flag.