CLICK ON CHART TO ENLARGE
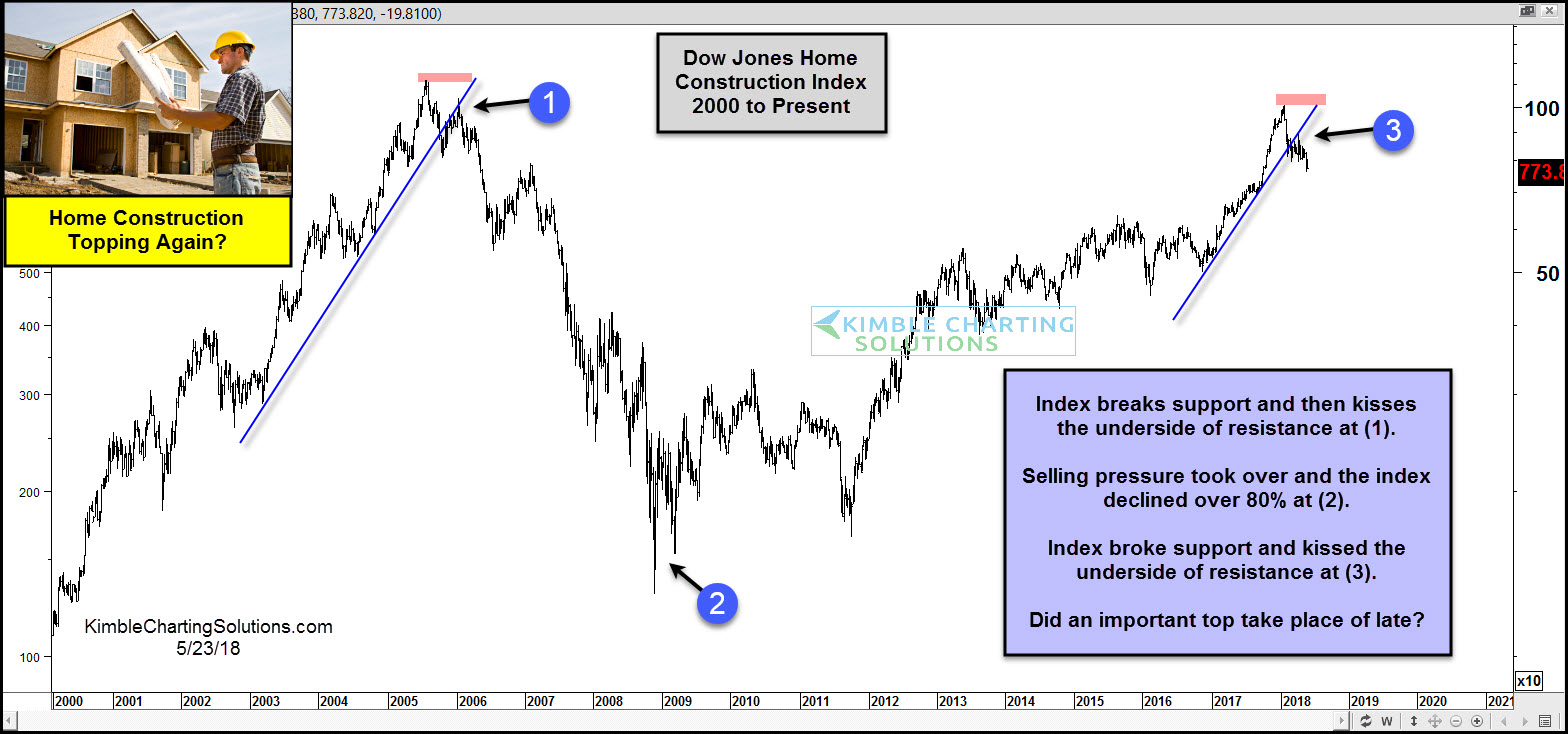
Few industries are more important to the overall economy than the Housing Sector. The chart above looks at the Dow Jones Home Construction Index over the past 18-years and how it has peaked and bottomed ahead of the broad markets in the past.
The index rallied several hundred percent over a 5-year period in the early 2000’s. It broke support and the kissed the underside of new resistance at (1), where selling pressure started ramping up. Over the next few years, the index fell more than 80%. The broad market struggled to move much higher once the index started turning weak in the 2000’s.
Over the past 5-years, the index has rallied several hundred percent again, taking in back to just under the peak in 2005. Recently the index has broken below steep support and has kissed the underside of resistance, where selling pressure has started taking place at (3).
Did an important top in the Home Construction index again? It is too soon to tell. One thing the bulls do not want to see here is further selling pressure for this sector to place at (3)!
CLICK ON CHART TO ENLARGE
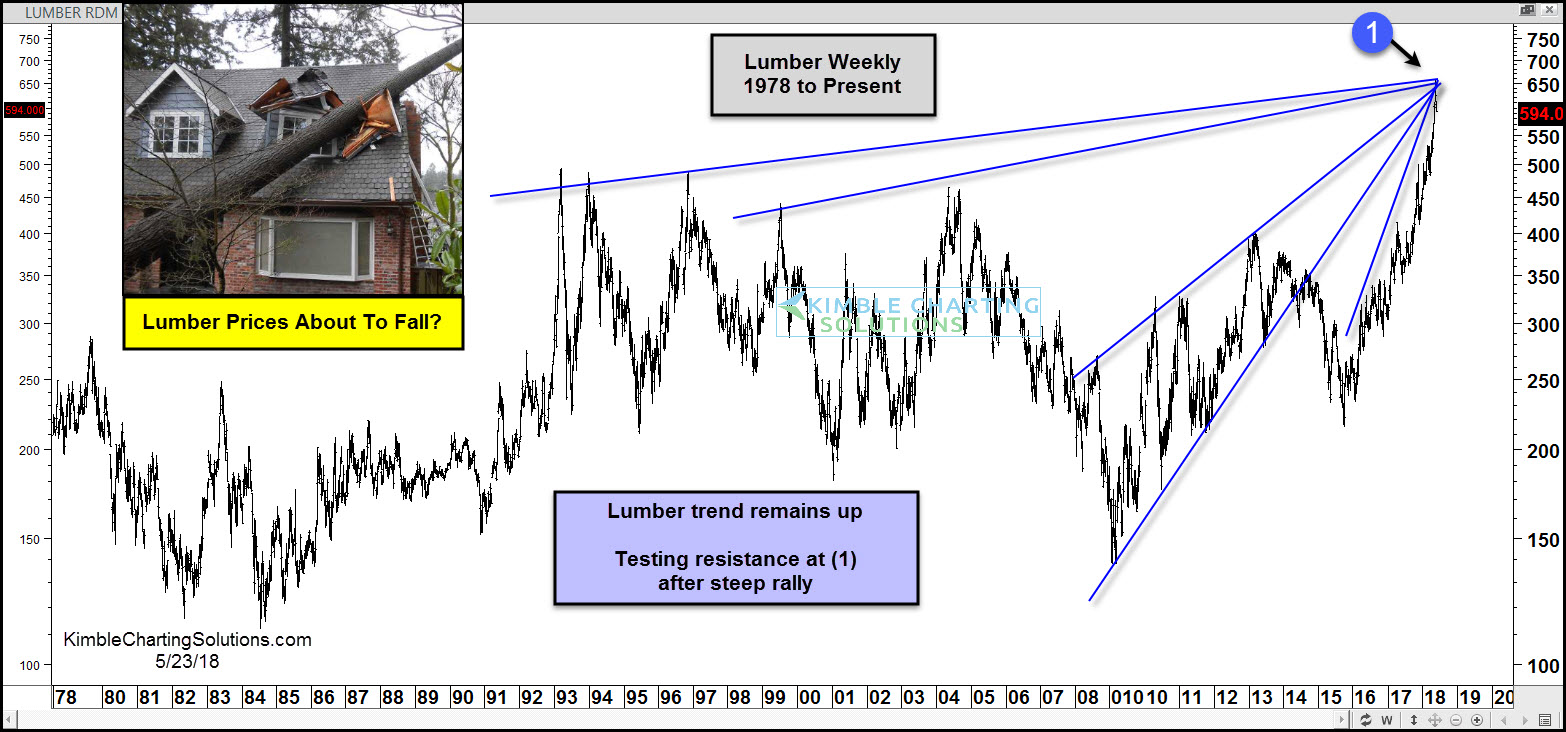
This chart looks at Lumber prices over the past 30-years. The trend in lumber prices remains up.
The strong rally over the past couple of years has it testing a cluster of resistance at (1).
If history is any guide, the broad market DOES NOT want to see the Home Construction Index and Lumber start heading lower from these key levels!