Wolf Richter wolfstreet.com, http://www.amazon.com/author/wolfrichter
There is plenty of supply, but it’s the wrong supply, priced too high.
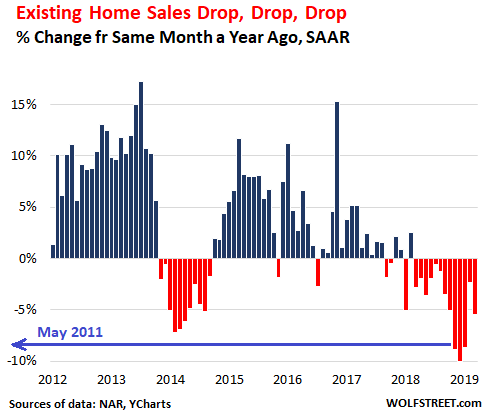
Across the US, hot and cold housing markets all thrown into one bucket: Sales of “existing homes” (single-family houses, townhouses, condos, and co-ops) in March dropped 5.4% from March last year, to a seasonally adjusted annual rate of 5.21 million homes, according to the National Association of Realtors, after having dropped 2.3% year-over-year in February, 8.7% in January, 10.1% in December, and 8.9% in November (data via YCharts):
“The impact of lower mortgage rates has not yet been fully realized,” the NAR report said, as the drop in sales volume is occurring despite the fact that mortgage rates had fallen sharply from the November highs.
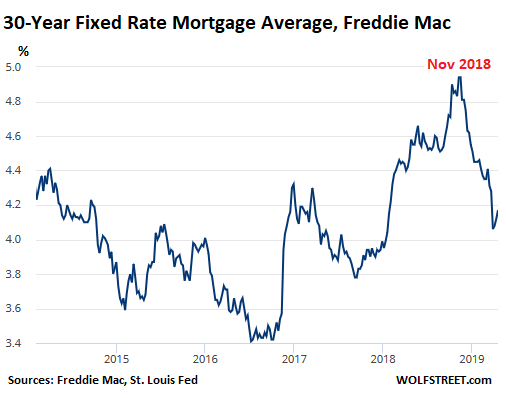
“According to Freddie Mac, the average commitment rate for a 30-year, conventional, fixed-rate mortgage decreased to 4.27% in March from 4.37% in February,” the report said.
The average Freddie Mac 30-year fixed rate bottomed out in the reporting week ended March 28 at 4.06%, the lowest since January 2018, and down from 4.94% in November. But it has since risen every week. For the week ending April 18, it ticked up to a still low 4.17%:
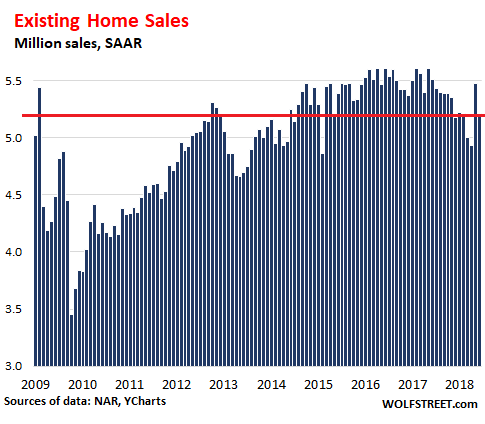
It seems all the lower mortgage rates have accomplished is a slowdown in the decline of sales volume. Even the spike in February, which appears to have been a fluke, was still 2.8% below February 2018. And in March, at 5.21 million homes seasonally adjusted annual rate (SAAR), sales were back where they had been in March 2015 (data via YCharts):
Sales volume by type of home in March, compared to March 2018:
- Single-family houses: -4.7% to 4.67 million SAAR.
- Condos: -11.5% to 540,000 SAAR.
Sales volume by region in March, compared to March 2018, with the West and the Midwest showing the steepest declines. Total sales in SAAR:
- Northeast: -1.5%, to an annual rate of 670,000
- Midwest: -8.6%, to an annual rate of 1.17 million
- South: -2.1%, to an annual rate of 2.28 million
- West: -10.7%, to an annual rate of 1.09 million.
Inventory of for sale at the end of March was up 2.4% year-over-year to 1.68 million homes. At the current rate of sales, this represents 3.9 months’ supply. In other words, there is now plenty of supply, but declining sales volume tells us that it’s the wrong kind of supply, with prices too high for potential buyers.
“The lower-end market is hot while the upper-end market is not,” according to the NAR report. “The expensive home market will experience challenges due to the curtailment of tax deductions of mortgage interest payments and property taxes.”
Alas, in many markets, even the “lower end,” after years of price surges, has become very expensive.
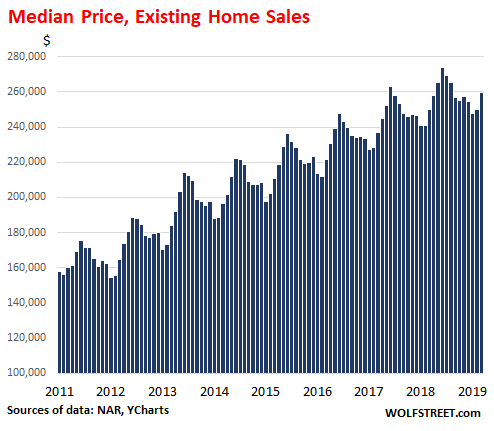
So, with all markets across the US thrown into one bucket, the median price in March rose 3.8% from March last year to $259,400. Prices are subject to seasonality, as the chart below shows. Median price means half the homes sold for more, and half sold for less:
By category: For an existing single-family house, the median price in March rose 3.8% year-over-year to $261,100. For an existing condo, the median price rose 3.6% to $244,400. Median home prices by region:
- Northeast: +2.5% year-over-year, to $277,500.
- Midwest: +4.6% year-over-year to $200,500.
- South: + 2.4% year-over-year, to $227,400.
- West: +3.1% year-over-year, to $389,300.
Persistently declining sales on rising inventories and rising prices is the phenomenon of potential buyers and sellers being too far apart, and sellers being unwilling to lower their prices to where the potential buyers are.
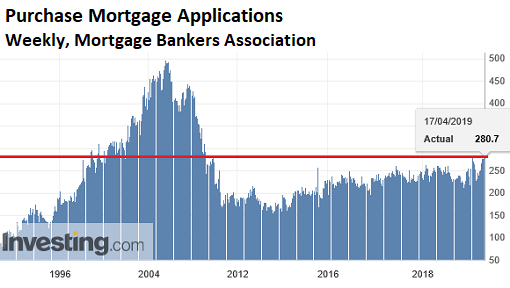
The hope has been that the recent drop in mortgage rates would encourage buyers to step up to the plate. And mortgage applications have risen this year, according to the Mortgage Bankers Association, showing that lower mortgage rates encouraged some fence-sitters to apply for a mortgage to purchase a home. The chart below (via Investing.com) shows “purchase mortgage” applications and not “refinance mortgage” applications:
But many homes are bought by domestic and foreign investors and by other cash buyers that don’t need mortgages. Large investors can borrow at the institutional level. And they’re not necessarily swayed by lower mortgage rates. And this may be the phenomenon we’re seeing here.