via UPFINA:
Markets are about to face an onslaught of news in October, with most of it occurring within 2 weeks. It was just announced that President Trump and Chinese Vice Premier Liu He will meet in Washington D.C. on October 10th and the 11th. Liu came to America as a special envoy on behalf of President Xi this spring, but lost the title after the Chinese Communist Party felt he gave too many concessions in his negotiations. He had agreed to buy American soybeans. It would be problematic if he agrees in principle to a trade deal that the Communist Party balks at. The bright side is at least Liu has worked well with America previously.
The Democratic Primary debates will be on October 15th and 16th as 12 candidates will face off. In the one in November, there will be fewer candidates because the threshold to make the debate was raised. The October debates will still impact markets if it alters the polls. We will get into how the election is affecting markets later in this post. Thirdly, earnings season is starting in mid-October. The Fed is also meeting, but that’s occurring later in the month (October 30th).
Investors Aren’t Positive
The stock market is in a weird situation where it has had a great year and is near its record high, yet individual investors aren’t very bullish. That’s a good sign for the bulls. In the week of September 25th, the percentage of individual investors that were bullish, according to the AAII survey, fell 6% to 29.4%. The percentage of bears rose 5.4% to 33.3%. There are more bears than bulls even though the market has had a great year.
Investors are likely worried about the trade war, the Democratic primary, earnings season, the economy, monetary policy, and the yield curve inversion. The chart below shows the 52 week rolling average of the percentage of bulls.
The rolling 52-week average of bullish sentiment has basically been trending lower this entire bull market. Read our newest post: https://t.co/ys56QHaURA pic.twitter.com/dtBzIAmMR2
— Bespoke (@bespokeinvest) September 26, 2019
Investors aren’t that positive compared to the past 30 years. You wouldn’t think the market had amazing performance in the past 10 years by looking at sentiment. Can stocks climb the wall of worry again?
A Perfect Performance For Housing Results
Existing home sales, the housing market index, new home sales, MBA purchase applications, housing starts, and permits have all been heading in a positive direction. The August pending home sales report continued that run as it showed 1.6% monthly growth which beat estimates for 0.6% growth and was above July’s reading of -2.5%. The index improved from 105.6 to 107.3 which is consistent with 2.5% yearly growth.
Contract signing usually lead sales by 45 to 60 days. Pending home sales signal new home sales will be strong this fall and new home sales signal starts will be strong in Q4. Real residential investment growth could go from hurting GDP growth for 6 straight quarters to helping it significantly in the 2nd half of 2019. Cornerstone Macro has a model, done before this data release, which uses median income and mortgage rates to predict new and pending home sales growth. It expects yearly growth of 13.3% in Q4.
We haven’t even gotten to Q4 where the pending home sales index’s comps are much easier. The index fell to 98.7 in December 2018. The graphic below shows the breakdown by region.
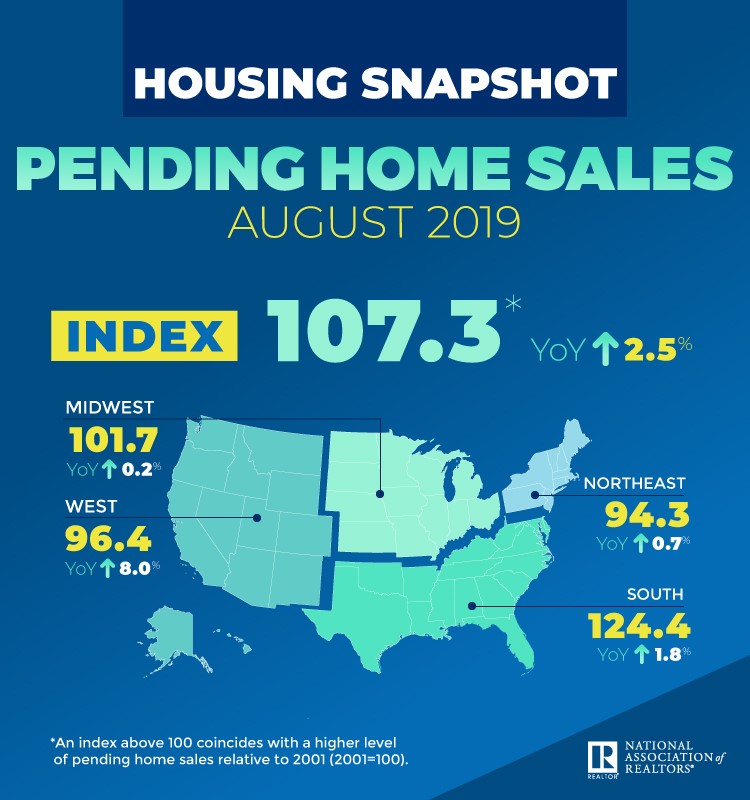
Anything above 100 means housing activity is higher than the historical average. Similar to the new home sales report, the West had amazing growth in pending home sales as it was up 3.1% monthly and 8% yearly. However, it’s still below 100. The biggest region, which is the South, had monthly growth of 1.4% and yearly growth of 1.8%. Its index is the highest by far as it is at 124.4.
Profit Margins Decline & National Income To Workers Rises
There’s a misnomer that profit margins are extremely high because people only look at the S&P 500. The situation isn’t as great for small firms which are being hurt by rising labor costs. As you can see from the chart below, NIPA corporate profit margins have been declining for 4.5 years which is the longest run of declines in post-war history.
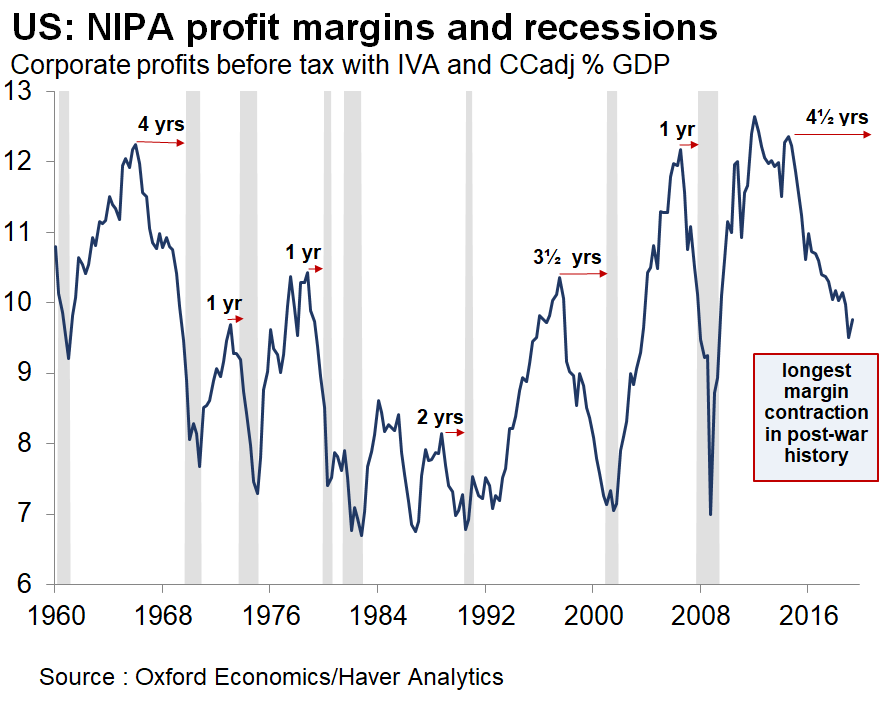
Previous declines have ended with a recession. So far, this decline in margins hasn’t led to a burst in layoffs as jobless claims in the week of September 21st were 213,000.
We are pairing this chart on profit margins with the chart below which shows the percentage of national income going to workers. Profit margins have fallen in the past 4.5 years and the percentage of the national income going to workers has increased.
Breaking Rich's Ratio news https://t.co/llv0bqM4jT pic.twitter.com/yDV6GESN9G
— Matthew B (@boes_) September 26, 2019
To be fair to those claiming income inequality is still large, the current percentage is below most of the troughs in the past few decades. Furthermore, the Gini coefficient, which measures inequality (higher is less equal & 1 is the highest possible) has increased from 0.43 in 1990 to 0.49 in 2018.
Warren Presidency Priced Into One Stock At Least
We can never know what is priced into the market. Sometimes it seems like a catalyst is priced in and then it occurs and the market still reacts to it. A Warren presidency can’t be priced in because she hasn’t won the nomination yet. In the latest national poll, she was down by 11%. Even in that poll, which shows her losing, she still has momentum as she gained 4 points since late August and Biden lost 4 points.
As you can see from the chart below, the odds of her winning the nomination have been inversely correlated with UnitedHealth Group’s stock.
According to Matt Maley of MillerTabak, some traders are starting to call shares of UnitedHealth the "Elizabeth Warren Indicator" because of the presumed risk to its business model if she wins the White House pic.twitter.com/fFRwERrtP5
— Joe Weisenthal (@TheStalwart) September 26, 2019
Her support of Medicare for All won’t be great for insurers and her support of strict banking regulations won’t be great for the banks. The election could even be hurting manufacturing firms as a firm in the Kansas City Fed manufacturing report stated, “Trade deals are important. 50%+ exports for us is to Mexico and Canada. Election year looks to be slowing decisions for customers already.”
The debates on October 15th and 16th will have 12 candidates. All that matters is if the top ones go head to head. Warren’s poll numbers have been boosted by the debates. The lineups will be announced after October 1st which is the deadline to make the debate.
Conclusion
The term “October surprise” is overused, but we thought it was apt here because of all the news events coming out in mid-October. Politics, trade negotiations, earnings, economic news, and Fed policy will make news next month. This might be causing the sentiment survey to show more bears than bulls even though stocks are near their record high. If you’re a bull, you like to see a high percentage of bears and a low percentage of bulls.