by howmuch
After Obamacare was passed in 2010, the rate of uninsured people steadily declined for several years. But then, a couple years ago the trend reversed, and the number of uninsured Americans started to rise. Our latest map breaks down how many Americans don’t have health insurance living in each state.
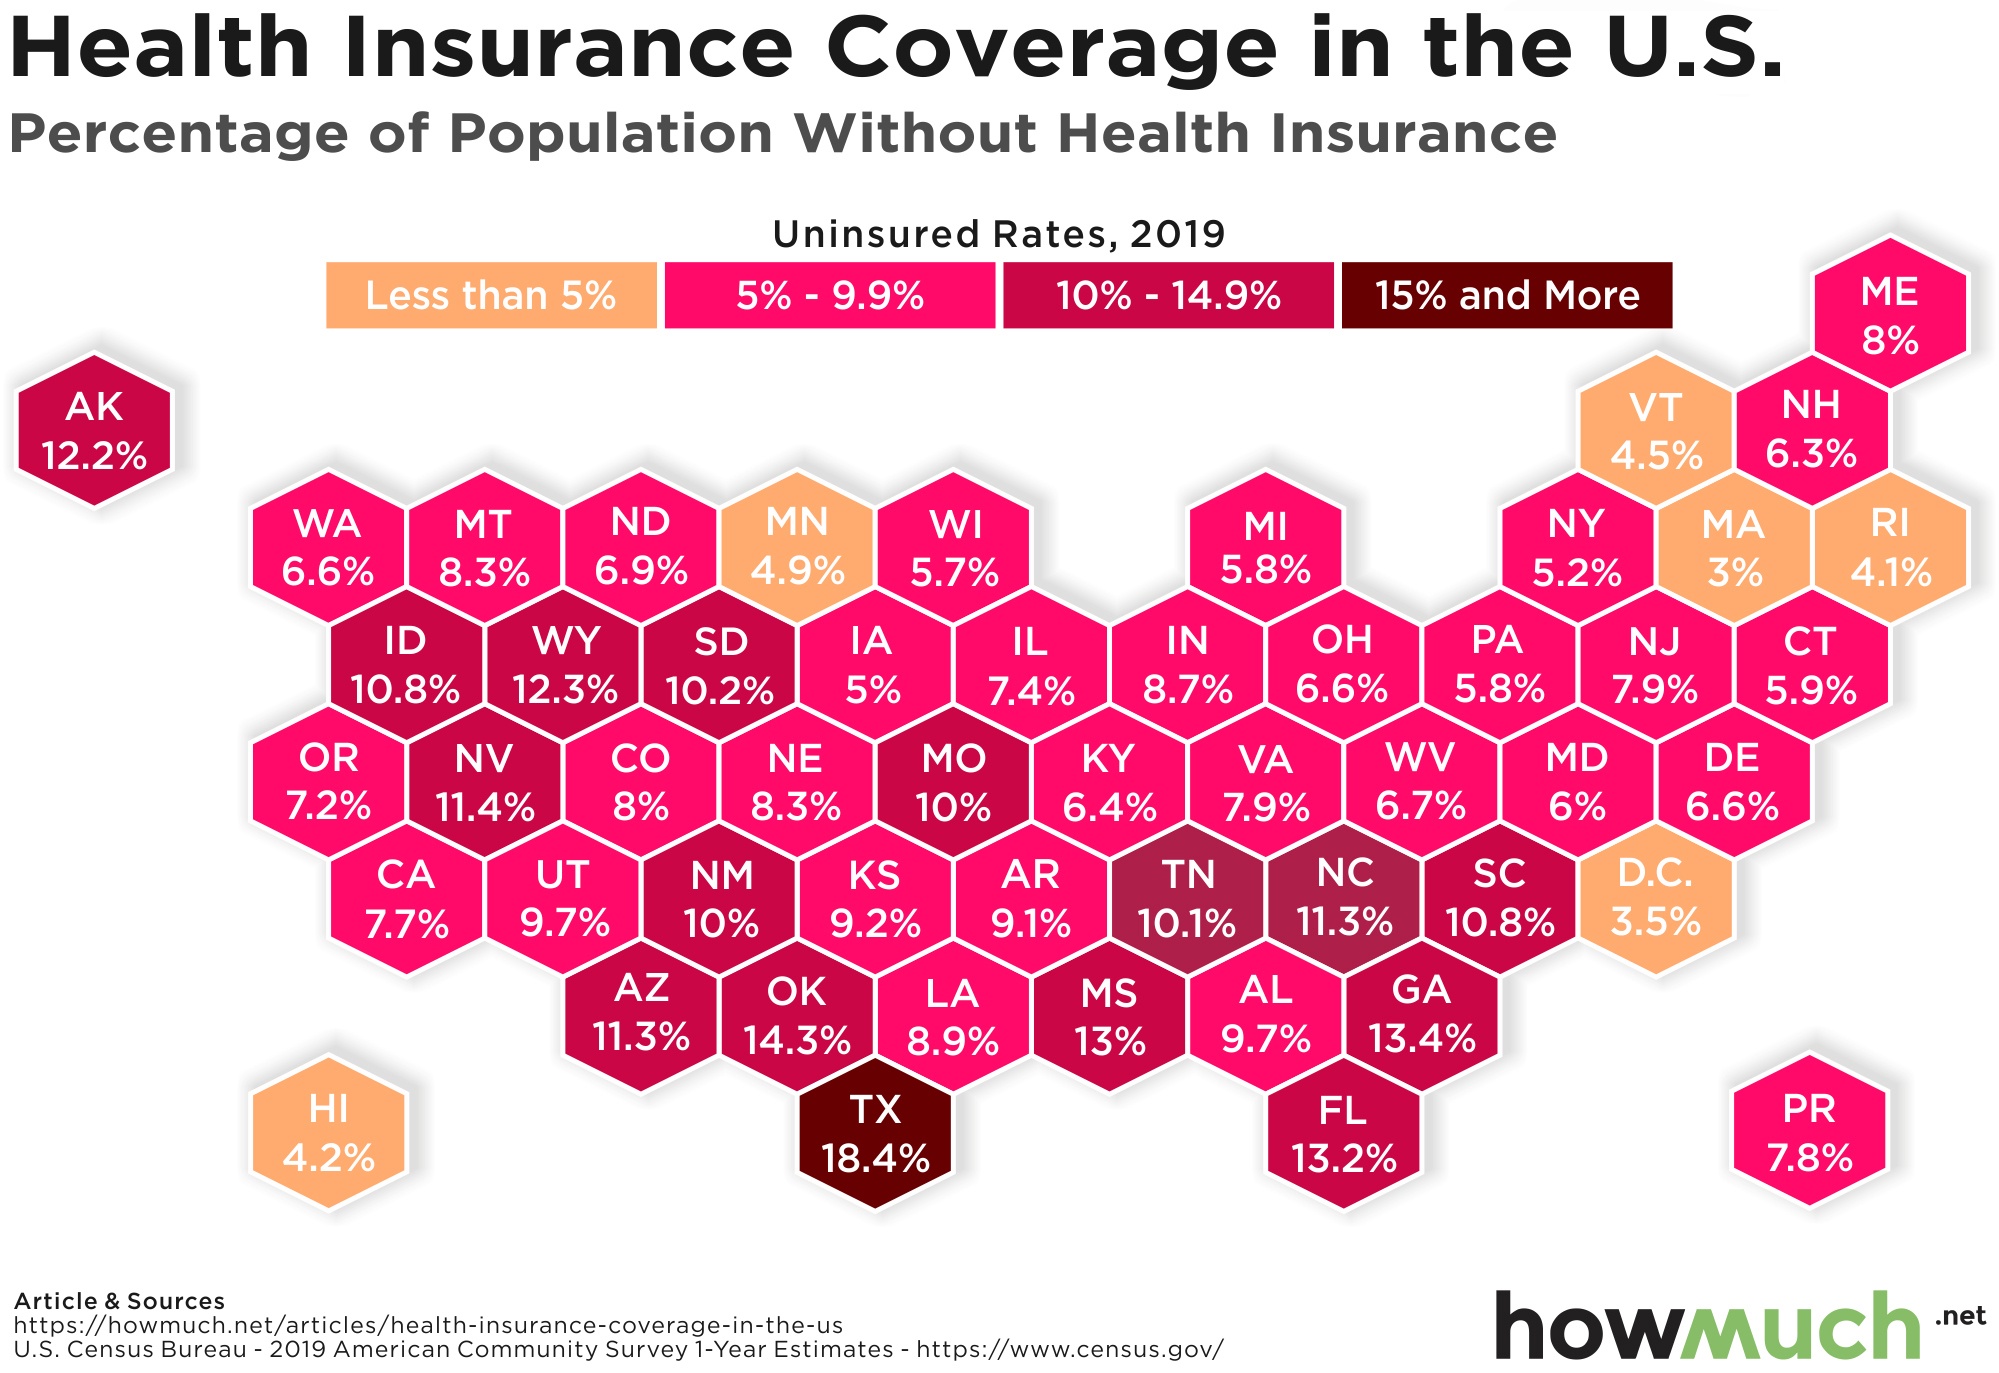
- Texas easily has the highest rate of uninsured people of any state in the country, with 18.4% of the entire state’s population without coverage.
- Our map shows that across the South, many states have double-digit percentages of uninsured people, including Oklahoma (14.3%), Georgia (13.4%) and Florida (13.2%).
- Massachusetts has the single best rate of insurance coverage in the country, with only 3% lacking coverage.
- There’s a cluster of states in the Northeast with similarly low rates of uninsured people, highlighting a major regional gap between the North and South for health insurance coverage.
We got the data for our map directly from the US Census Bureau, which runs an annual demographic survey of the U.S. called the American Community Survey (ACS). The ACS generates useful estimates through statistical sampling of the population. In this case, we generated a simple heat map to show the percentage of people who don’t have health insurance coverage. The darker color, the more people there are who don’t have insurance. The result is an intuitive snapshot of who has coverage, and who doesn’t. We are showing 2019 rates, the latest data available.
Top 10 States With the Highest Percentage of Uninsured Americans
| State | Population without health insurance (%) |
|---|---|
| 1. Texas | 18.4% |
| 2. Oklahoma | 14.3% |
| 3. Georgia | 13.4% |
| 4. Florida | 13.2% |
| 5. Mississippi | 13% |
| 6. Wyoming | 12.3% |
| 7. Alaska | 12.2% |
| 8. Nevada | 11.4% |
| 9. Arizona | 11.3% |
| 10. North Carolina | 11.3% |
Health insurance is a key cornerstone of personal financial security. The cost of medical care for certain conditions in the U.S. is prohibitively expensive. In fact, health issues are frequently cited as a leading contributor to bankruptcies. Regardless if someone has health insurance from an employer or directly through a government program, expanding insurance coverage to more people is a specific way to decrease poverty in the U.S.
And our map makes it clear which states are doing a good job, and which ones are doing a bad job, in making sure their people have health insurance coverage. Texas easily leads the country as the state with the greatest percentage of uninsured people at 18.4%. Oklahoma isn’t too far behind at 14.3%, followed by Georgia at 13.4%. Five out of the top ten states with the highest rates of uninsurance are all across the South, with several states from Arizona (11.3%) to South Carolina (10.8%) breaking the double-digits.
The situation in the South stands in contrast to North and Northeast, where apparently a lot more people have access to health insurance coverage. Massachusetts leads the country with the lowest rate of uninsured people (3%). There is some irony in how the healthcare plan Mitt Romney implemented for Massachusetts paved the way for Obamacare, which greatly expanded the ranks of insured Americans by covering an additional 30 million people. Several other states in the Northeast also boast insured percentages in the low single digits, like Rhode Island (4.1%), Vermont (4.5%) and New York (5.2%). Clearly it is much better to live in the North than the South when it comes to staying covered in case of major health problems.
If you don’t have health insurance right now, it’s a good idea to get covered. Check out our health insurance cost guide to get started today.