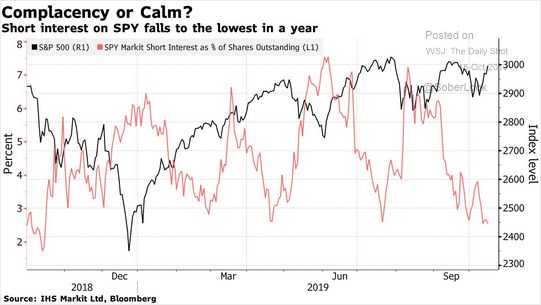
In a recent weekly newsletter (Subscribe for free e-delivery), I discussed the rather dramatic decline of short-interest in the S&P 500 which suggests a high degree of complacency by investors.
As Wolf Richter recently noted:
“Of the total shares outstanding of the SPDR S&P 500 ETF, only 2.6% were out on loan to short-sellers this week, the lowest since early October 2018, and down from 7% during the summer,according to IHS Markit data cited by Bloomberg. Meaning that short-sellers who want to short the entire market, and not specific companies, are worried that the market will break out, powered by a Brexit deal or a miraculous US-China trade deal as per presidential tweet, or whatever, and rip their faces off if they’re short the market.”
In other words, optimism about the “bull market” continuing is actually rather high, despite seemingly negative sentiment from headlines.
As Wolf goes on to note, short-sellers are “speculators” in the purest form. They are also leveraged investors who have been deleveraging as of late. The chart below shows margin debt as reported by FINRA, as compared to the “free cash balance” of investors.

You can see that since May 2018, the level of “negative cash balances” has improved as margin debt has declined. However, we need to keep this in perspective as even with the recent improvement, negative cash balances are still twice as high as any other point in history.
More importantly, note the events related to increases in margin debt. Clearly, a decade of ultra-low interest rates, ongoing liquidity infusions by Central Banks, and surging levels of stock buybacks have emboldened speculators to take on ever-increasing levels of “risk” through leverage.
This deleveraging process over the last year, combined with the sharp drop in “short interest,” suggests the speculative investors have become much more cautious on the market.
However, is this more negative positioning, a contrarian signal for the markets?
Are The Bulls In The Clear?
Maybe not.
“According to research conducted in the 1970s by Norman Fosback, then the president of the Institute for Econometric Research, there is an 85% probability that a bull market is in progress when margin debt is above its 12-month moving average, in contrast to just a 41% probability when it’s below.”
Currently, margin debt has crossed below the 12- month average. If we take a longer-term look at the data we find that breaks of the 12-month moving average have indeed provided a decent signal to reduce equity risk in portfolios (blue highlights). Yes, as with any indicator, there are times that it doesn’t work, but more often than not, it has provided a reasonable assessment of elevated risk.
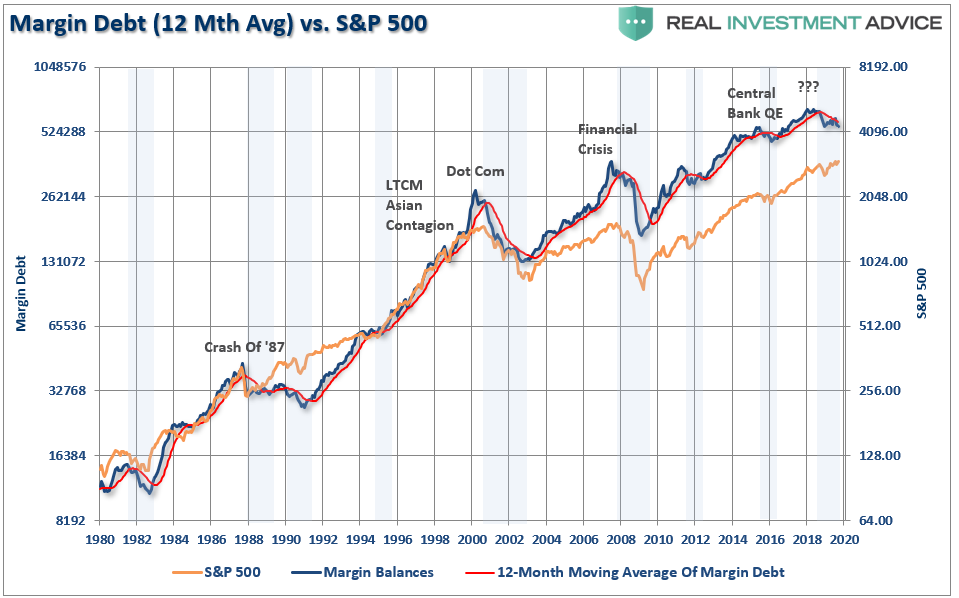
Importantly, margin debt is not a technical indicator which can be used to trade markets. Margin debt is just additional “gasoline” to lift asset prices higher as the leverage provides for additional purchasing power. However, “leverage” also works in reverse as it provides an accelerant for larger declines as lenders “force” the liquidation of assets to cover credit lines without regard to the borrower’s position.
That last sentence is the most important. The issue with margin debt, in particular, is that the unwinding of leverage is NOT at the investor’s discretion. It is at the discretion of the broker-dealers that extended the leverage in the first place. (In other words, if you don’t sell to cover, the broker-dealer will do it for you.) When lenders fear they may not be able to recoup their credit-lines, they force the borrower to either put in more cash or sell assets to cover the debt. The problem is that “margin calls” generally happen all at once as falling asset prices impact all lenders simultaneously.
Margin debt is NOT an issue – until it is.
It is when an “event” causes lenders to “panic” that margin becomes problematic. As I discussed previously:
“If such a decline triggers a 20% fall from the peak, which is around 2340 currently, broker-dealers are likely going to start tightening up margin requirements and requiring coverage of outstanding margin lines.
This is just a guess…it could be at any point at which ‘credit-risk’ becomes a concern. The critical point is that ‘when’ it occurs, it will start a ‘liquidation cycle’ as ‘margin calls’ trigger more selling, which leads to more margin calls. This cycle will continue until the liquidation process is complete.
The last time we saw such an event was here:”
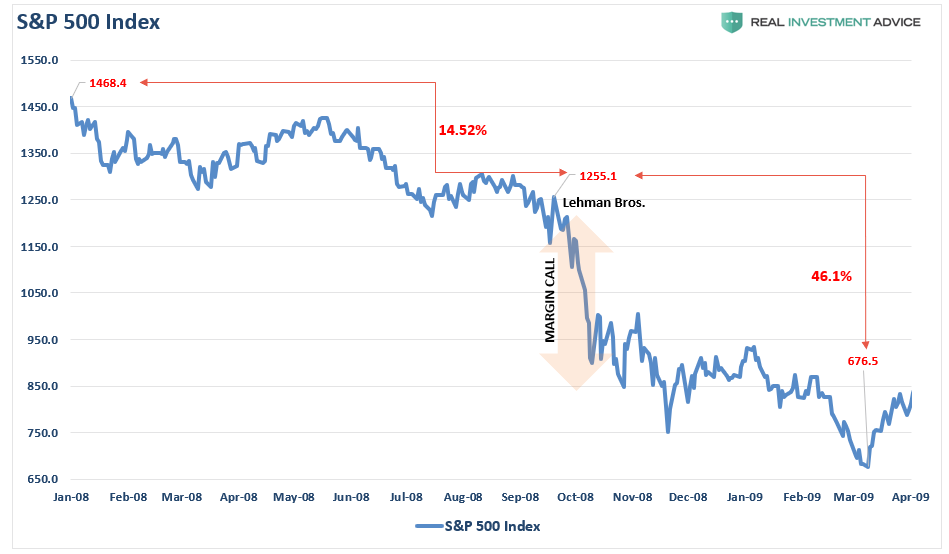
Note in the chart above the market had two declines early in 2008, which ‘reduced’ margin debt but did NOT trigger “margin calls.” The event which caused lenders to panic was when Lehman Brothers was forced into bankruptcy and concerns over counter-party risk caused banks to dramatically reduce their “risk exposure.”
We never know what the catalyst will be which forces lenders to become concerned about “default” risk, but there is more than sufficient leverage in the market, with deteriorating credit quality, to supply an “event.”
Nothing to see here….move along. pic.twitter.com/rJMeONuxTJ
— Lance Roberts (@LanceRoberts) October 23, 2019
Growth Rate Vs. Market
History, going back to 1959, also suggests the “bulls” should not be overly complacent with the modest pullback in “margin debt.”
While not always immediately coincident, there is a significant correlation between the growth rate in margin debt relative to the growth rate of the S&P 500 (both adjusted for inflation). Over the last year, the S&P 500 has struggled to make advances as margin debt growth has weakened.
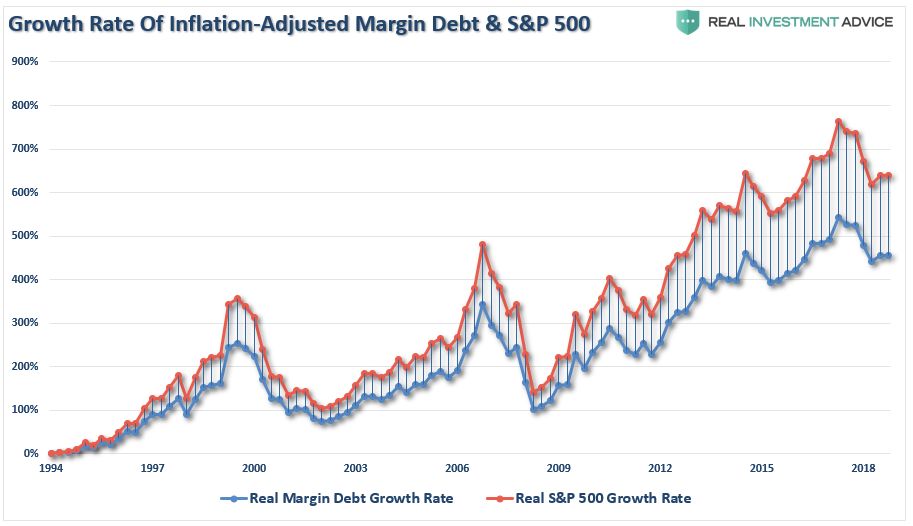
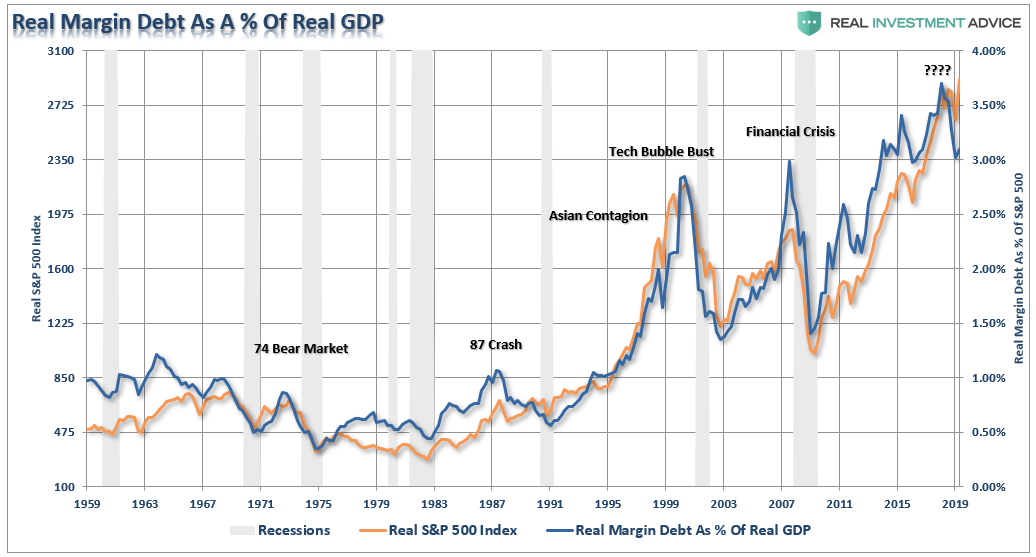
Furthermore, if we look at real, inflation-adjusted margin debt as a percent of GDP, the declines have also been coincident with both weaker economic and market outcomes.
It is hard to see what was happening prior to 1980. The next chart shows margin debt growth from 1959-1987.
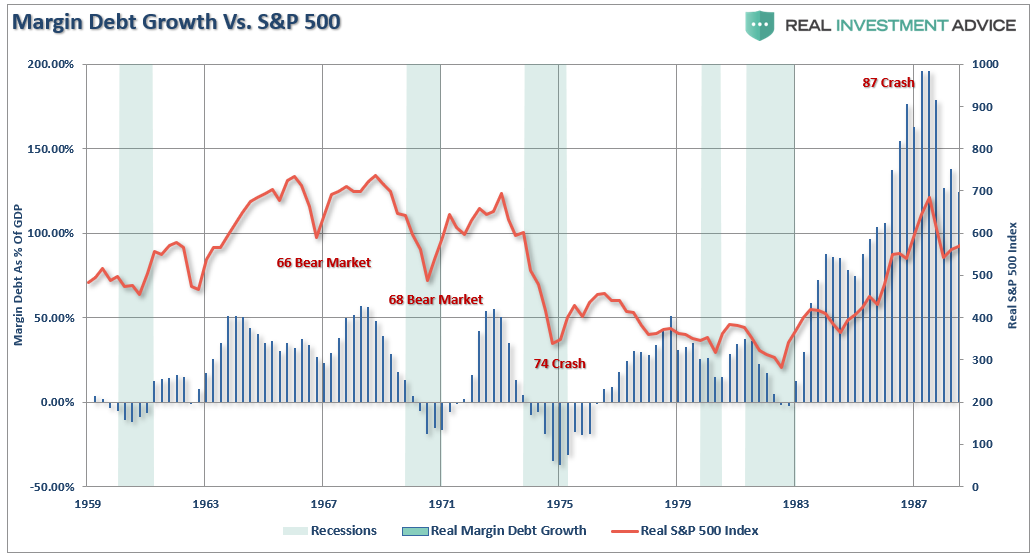
(Most people have forgotten there were three back-to-back bear markets in 1960’s-1970’s as interest rates were spiking higher. The 1974 bear market was the one that simply wiped everyone out!)
Again, what we find is a correlation between asset prices and margin debt. When margin growth occurs extremely quickly, which coincides with more extreme investor exuberance, corresponding unwinds of the debt have been brutal.
This time is not likely any different.
As shown, it is not uncommon for margin debt to start to unwind (margin debt inverted for clarity) before the bear market begins.

It’s All Coincident
When it comes to “margin debt,” it is a “coincident” indicator. Such should not be surprising since rising levels of margin debt are considered to be a measure of investor confidence. Investors are more willing to take out debt against investments when shares are rising, and they have more value in their portfolios to borrow against. However, the opposite is also true when falling asset prices reduce the amount of credit available and assets must be sold to bring the account back into balance.
I both agree and disagree with the idea that margin debt levels are simply a function of market activity and have no bearing on the outcome of the market.
By itself, margin debt is inert.
Investors can leverage their existing portfolios and increase buying power to participate in rising markets. While “this time could certainly be different,” the reality is that leverage of this magnitude is “gasoline waiting on a match.”
When an event eventually occurs, it creates a rush to liquidate holdings. The subsequent decline in prices finally reaches a point that triggers an initial round of margin calls. Since margin debt is a function of the value of the underlying “collateral,” the forced sale of assets will reduce the value of the collateral further triggering further margin calls. Those margin calls will trigger more selling forcing more margin calls, so forth and so on.
As I noted above, it will likely take a correction of more than 20%, or a “credit related” event, which sparks broker-dealer concerns about repayment of their credit lines. The risk to the market is “when” those “margin calls” are made.
It is not the rising level of debt that is the problem; it is the decline which marks peaks in both market and economic expansions.
Currently, the “bullish bias” remains intact, and the recent volatility in the market has not shaken investors loose as of yet. Therefore, it is certainly understandable why so many are suggesting you should ignore the recent drop in margin debt.
But history suggests you probably shouldn’t.