
Over the last three weeks, as interest rates surged above 3%, we explored the question of whether something had “just broken” in the market.
- Did Something Just Break? 10-05-18
- Yes, Something Just Broke 10-12-18
- Market Clings To Support – 10-19-18
As I stated last week:
“This past week has been a decidedly tough struggle for stocks to pick themselves up after last week’s drubbing. While we saw a sharp reflexive bounce earlier this week, that bounce quickly faded as stocks returned to retest support at critically important levels.”
While the market was oversold last week, there was no follow through on bounces which ultimately led to “crash”open on Friday morning.
Now, all this SOUNDS terrible. And, after having THE single longest uninterrupted bull run in the history of the market with record low volatility it FEELS even worse.
So, before we get into the not so good news, let’s keep this all in perspective for a minute.
For the year:
- The S&P 500 index, not including dividends, is down 0.56%.
- The S&P 500 Total Return index is still positive by 0.98%
- A 60/40 model (60% Vanguard S&P 500 and 40% Vanguard Bond Fund) is down 1.72%
What has been different this year so far, is that bonds, while they have reduced the volatility of the recent decline in the S&P 500 index, have not contributed to portfolio returns this year so far. So, the only place to hide has been cash.
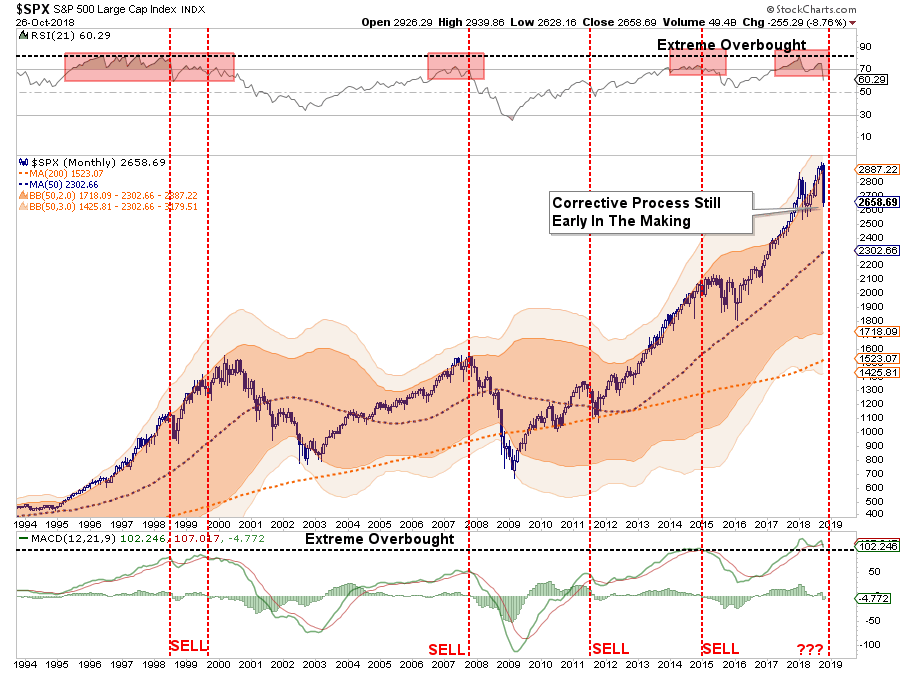
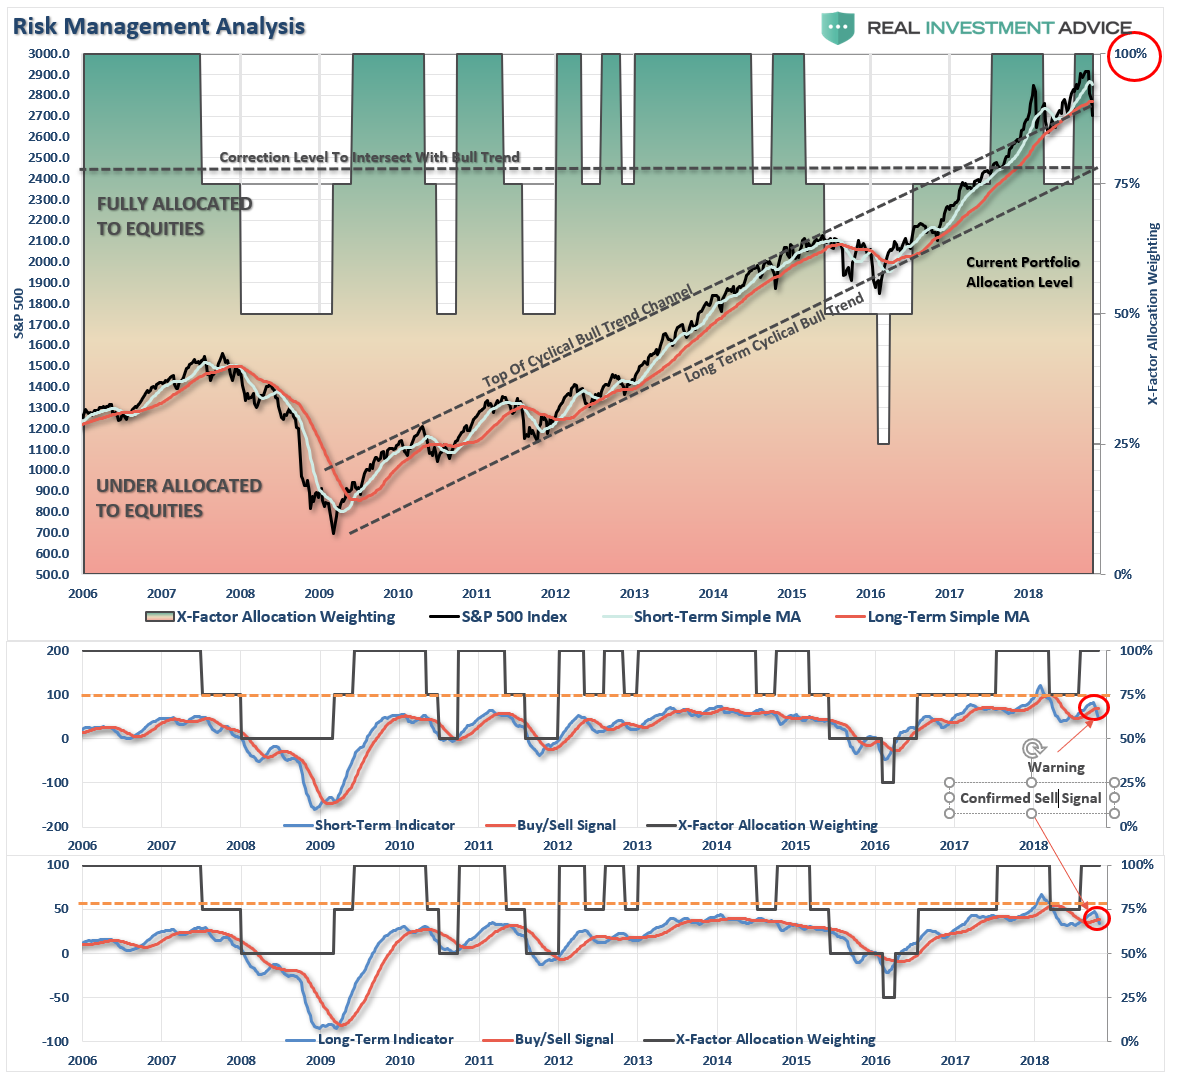
However, if we take a look at the market from 2009 to present, we can gain some better context.

The recent decline is very much like the previous corrections in the market. The red circles denote when both “sell signals” align (a correction of overbought conditions and a triggered sell signal). These corrections have specifically coincided with periods where the market was extremely deviated above the running bullish trend line (gold boxes.)
Currently, the correction, while painful in the short-term has been nothing more than a correction back to the running bullish trend.
So why worry?
The “difference this time,” is significant:
- The Fed is hiking rates versus either lowering or keeping them at zero.
- The Fed is reducing rather than increasing their balance sheet.
- The current Administration is insisting on a “trade war” which slows global growth.
- The economic cycle is mature rather than recovering.
- Record levels of debt at risk of rising rates versus a re-leveraging cycle with ultra-low rates.
- A mature housing, auto, and consumption cycle versus a recovery.
- Global central bank interventions have begun to taper versus expansion
- Peak earnings growth versus expansion
- Peak valuations versus expanding valuations
I could go on, but since you want “short and to the point,” I will stop there.
Here are some simple observations from Doug Kass (click here for recent interview) which dovetails into the following market analysis.
- The S&P Index and most non U.S. equity markets are broken technically.
- The worldwide fundamental outlook (economies and profits) are worse than are generally expected by the consensus.
- Few still believe a large equity markdown is likely.
- The consequences of a pivot in monetary policy in the U.S. (and elsewhere) is understated and not understood by many.
- There are now legitimate alternatives to stocks available in risk-free Treasuries. Those yields only recently have exceeded the S&P dividend yield.
- Stocks don’t go down in a straight line – it usually looks like a jagged line.
- We are in a new regime of volatility.
- A changing market structure – in which passive money overwhelms active money – remains a significant market risk and disruptive influence.
Daily View
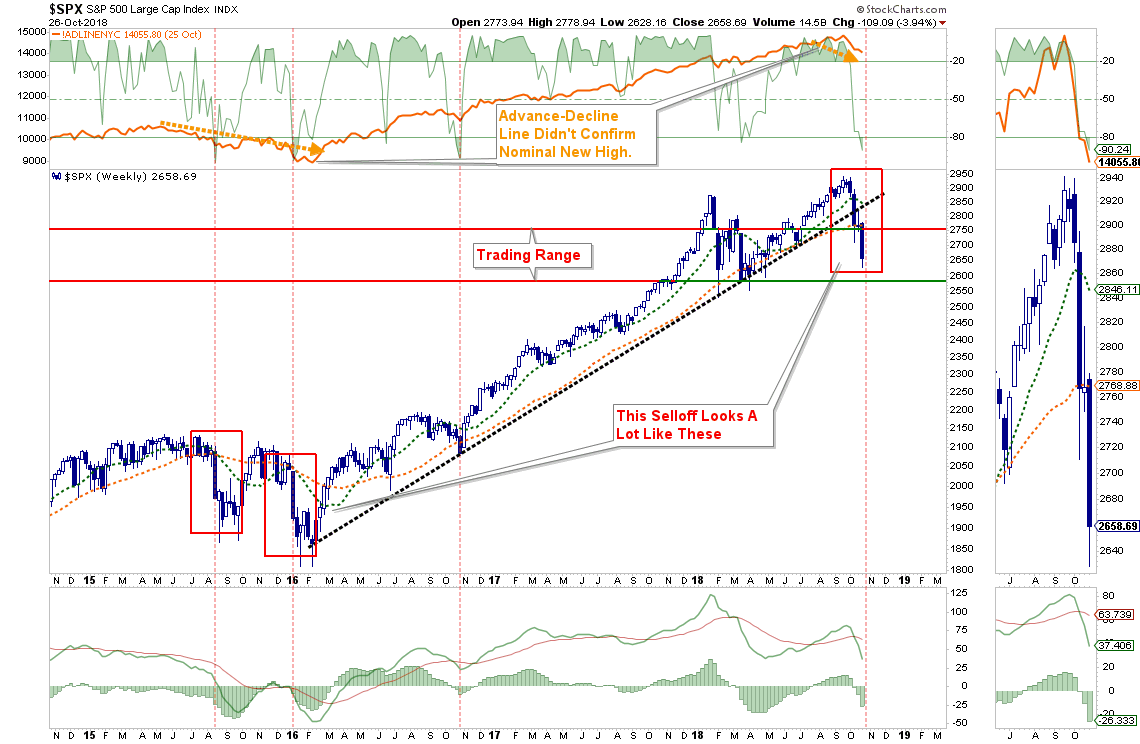
In early October, the market broke the bottom of the previous short-term bullish trend channel and tested initial support at the 61.8% retracement level of the push higher from the April lows. That move failed at the 38.2% retracement level and has now violated previous support this past week. This is not a good development and suggests that a failed rally back to that previous support will set the markets up for a retest of the April lows.
Action: Sell any rally next week.

Weekly View
On a weekly basis, the view doesn’t improve much. With the trendline from the 2016 lows now violated, the tenor of the market has changed from bullish to bearish. While the current selloff technically looks a lot like what we saw in late 2015 when the market fretted over Yellen’s decision to start hiking rates, this time is very different. As noted above, global Central Banks are not coming to the rescue, yet anyway, to inject liquidity into the markets, earnings have likely peaked, and global growth is contracting.
While technically there is a weekly confirmed sell-signal in place, the very oversold condition continues to suggest a short-term rally back to the top of the current trading range is likely.
Action: Sell any rally which gets near the top of the current trading range.
Monthly View
On a monthly basis, the backdrop has also worsened. RSI has dropped into correction territory along with a confirmed monthly sell signal. As I noted back in both December and September, extensions of the market that move 3-standard deviations above the long-term mean are unsustainable. Currently, a reversion back to the longer-term monthly average would entail a drop currently to 2300. A break below the February lows will likely confirm such a move is in process.
Action: Reduce risk on rallies, as detailed above, and look to add hedges on any breaks of long-term support
Actions To Take Next Week
With the market exceeding 3-standard deviations below the 50-dma currently, the extreme oversold condition still sets the market up for a fairly strong bounce. That bounce SHOULD be sold into.
Portfolio management processes have now been switched from “buying dips” to “selling rallies” until the technical backdrop changes.
- Re-evaluating overall portfolio exposures. It is highly likely that equity allocations have gotten out of tolerance from the original allocation models. We will reduce overall allocation models from 60/40 to 50/50 or less.
- Look to add bond exposure to mitigate volatility risk. (Read:The Upcoming Bond Bull Market)
- Use rallies to raise cash as needed. (Cash is a risk-free portfolio hedge)
- Review all positions (Sell losers/trim winners)
- Look for opportunities in other markets (Gold is showing signs of life.)
- Add hedges to portfolios (Short term treasuries, cash, and short positions on breaks of support)
- Trade opportunistically (There are always rotations that can be taken advantage of)
- Drastically tighten up stop losses. (We had previously given stop losses a bit of leeway as long as the bull market trend was intact. Such is no longer the case.)
If I am right, the conservative stance and hedges in portfolios will protect capital in the short-term. The reduced volatility allows for a logical approach to further adjustments as the correction becomes more apparent. (The goal is not to be forced into a “panic selling” situation.)
If I am wrong, and the bull market resumes, we simply remove hedges, and reallocate equity exposure.
See you next week.
Market & Sector Analysis
Data Analysis Of The Market & Sectors For Traders
S&P 500 Tear Sheet
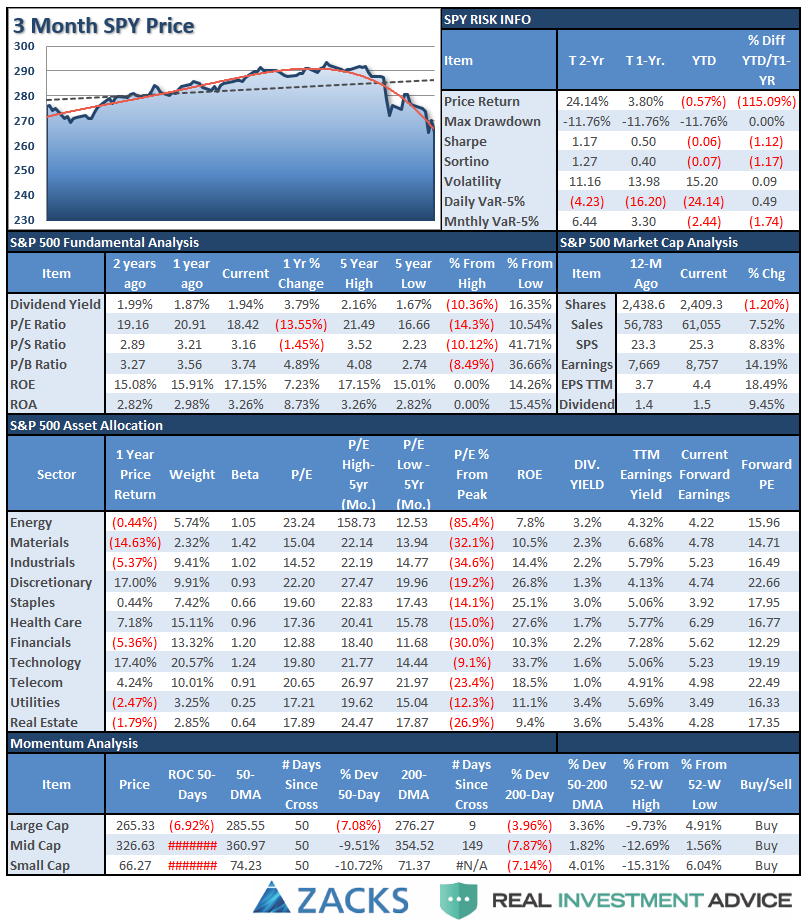
Performance Analysis
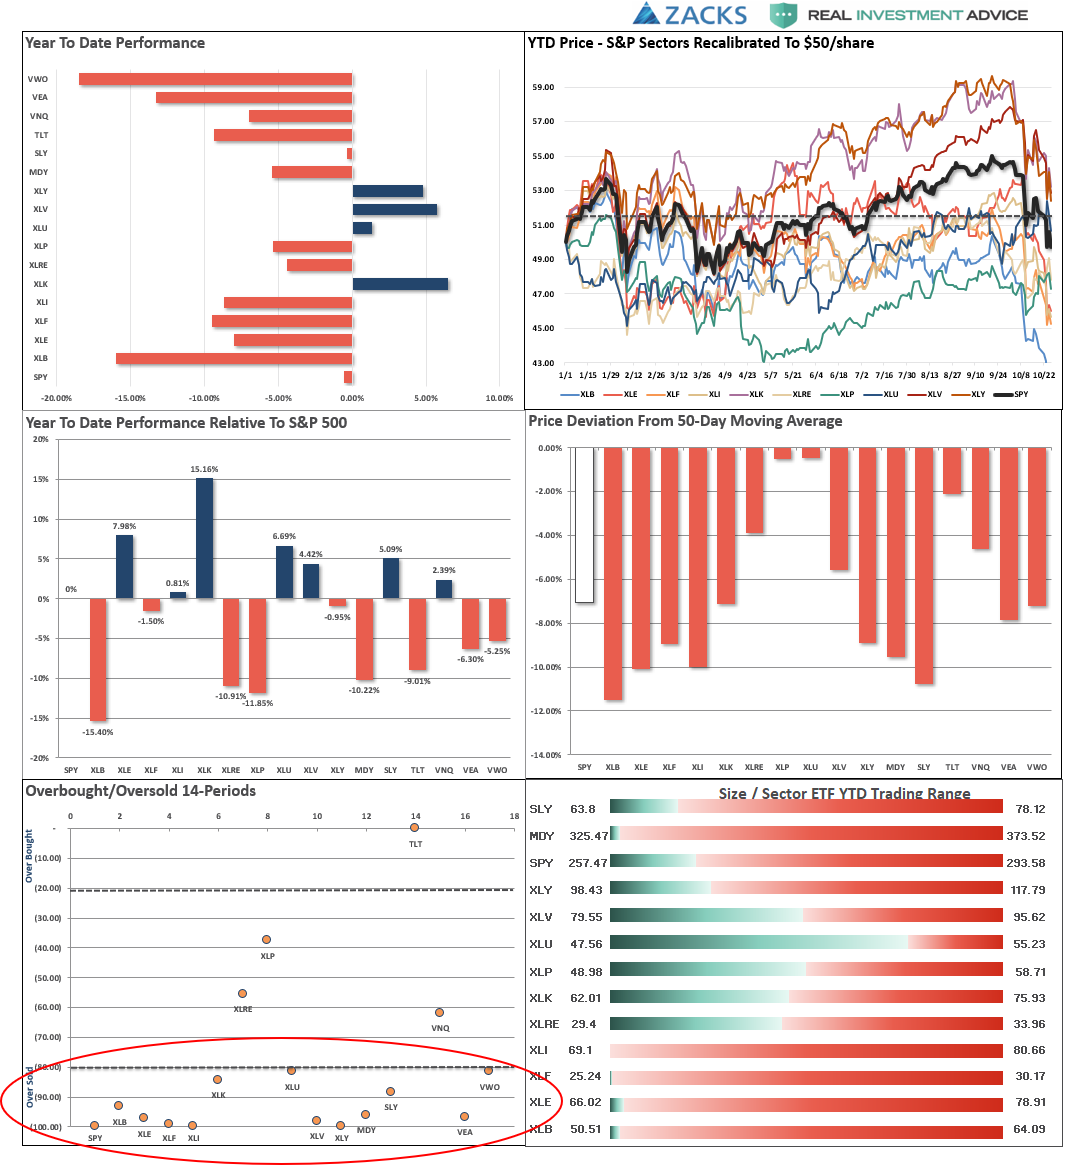
ETF Model Relative Performance Analysis
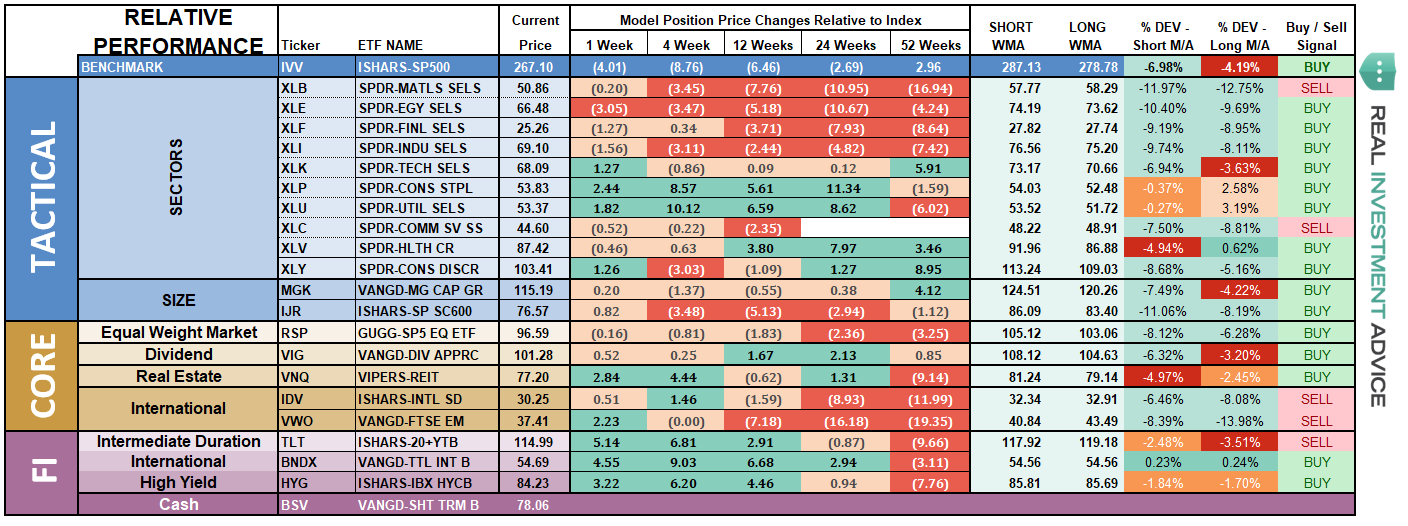
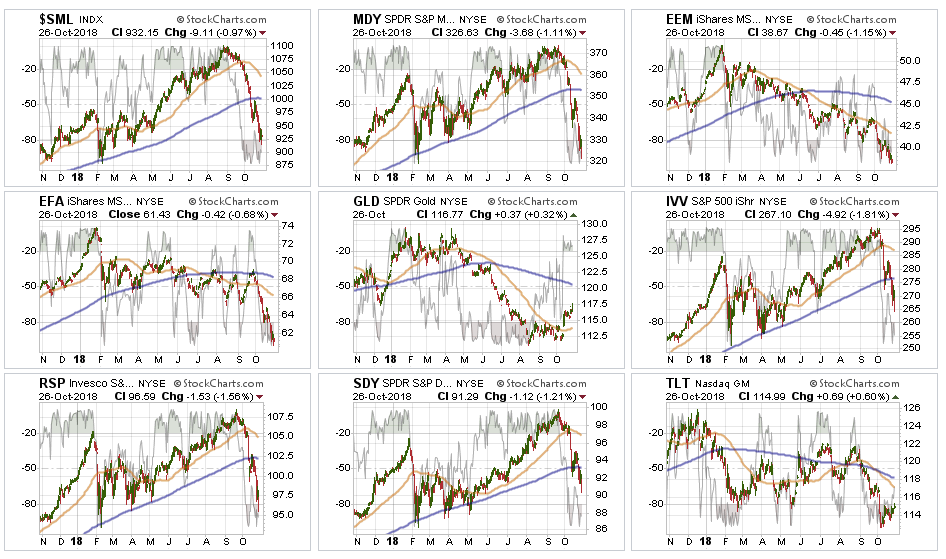
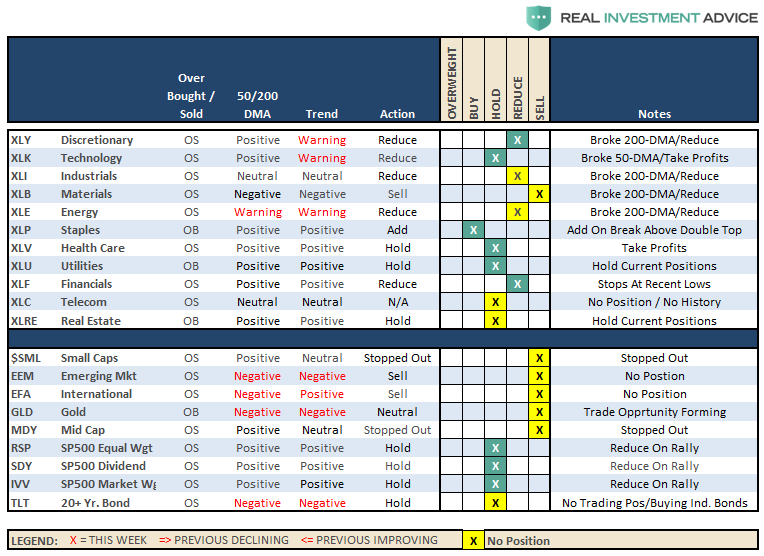
Sector & Market Analysis:
Sector-by-Sector

Discretionary, Industrials, Materials, Staples, Energy, and Financials have all violated their 200-dma and failed to recover. Financials are particularly troubling given the decent fundamental backdrop for banks currently. These sectors are now in “sell rallies” mode until there is a resumption of a more bullish trend. We have been out of Industrials and Basic Materials since the beginning of this year, and had previously taken profits in Technology and Discretionary. Positioning should be reduced on rallies back to broken support levels for now until performance improves. With extreme oversold conditions a bounce is likely next week.
Real Estate, Healthcare, Staples, Utilities have held their 200-dma support during the recent rout. Healthcare has been under severe pressure after an outsized performance earlier this year. The trend remains positive and is currently oversold, so a rally would not be surprising. Money is rotating to Staples, Utilities, and Real Estate in a “risk off” rotation. Be careful with REIT’s as the “actual” real estate market is under a lot of pressure from higher rates. This will eventually filter through to REIT’s.
Small-Cap and Mid Cap – the breakdown in small and mid-cap stocks suggest a broader change to the overall market complexion. Last week, both markets rallied and failed at their 200-dma and then broke their respective lows last week. These positions have been stopped out as we discussed last week.
Emerging and International Markets this past week, both markets collapsed lower. There still remains, since we recommended selling in January of this year, no reason to be long these sectors. Despite repeated calls about the “cheapness” of the global markets, they are screaming global recession. Stay out of these sectors for now.
Dividends, Market, and Equal Weight – The overall market dynamic appears to have changed last week. With the markets deeply oversold short-term look for a rally to reduce risk, rebalance weightings in portfolios, and raise some cash.
Gold – as I noted two weeks ago:
“After repeated failures at the 50-dma, the metal finally found some life in the midst of the recent market meltdown. With Gold now extremely overbought short-term, use this rally to sell holdings if you are deeply underwater. From a trading perspective, IF, and this is a big if, Gold can hold the 50-dma on a pullback and turn higher, a rally to the 200-dma is feasible. Such would coincide with a much bigger sell-off in stocks.”
That was indeed the case this past week. Gold is now in a tradeable position. With gold VERY overbought short-term look for a counter-rotation in the markets next week (stocks up and gold down). As long as Gold can hold $114-115 and work off the overbought condition a tradeable entry will be presented. (Gold up / stocks down)
Bonds – rallied last week as money started searching for safety. However, the index is now testing the previously broken bottoms at $115. We are still out of trading positions currently, and if we get a rally in stocks next week, we will likely see a retest of recent lows on bonds. All trading positions are currently closed.
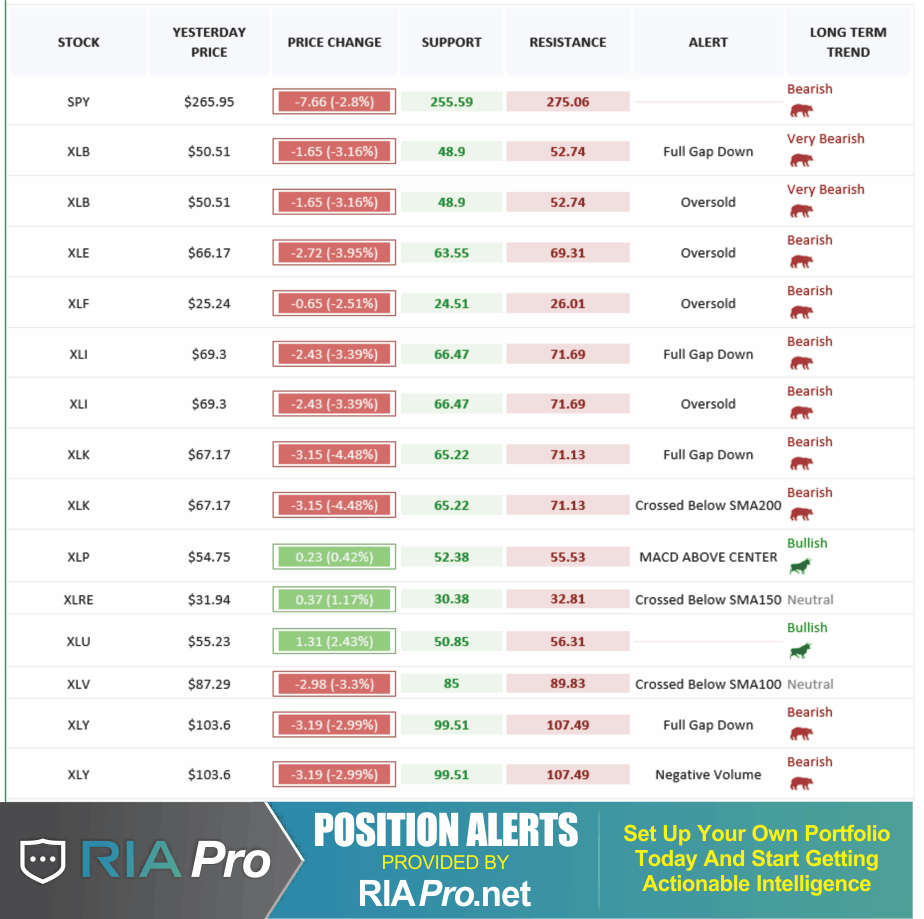
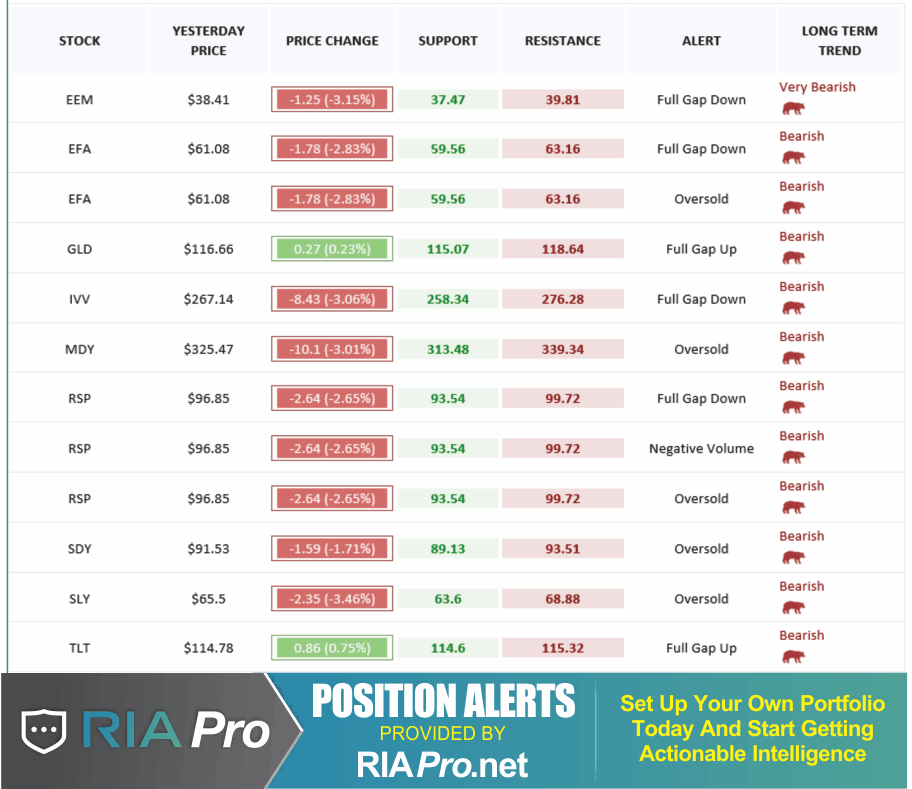
The table below shows thoughts on specific actions related to the current market environment.
(These are not recommendations or solicitations to take any action. This is for informational purposes only related to market extremes and contrarian positioning within portfolios. Use at your own risk and peril.)
Portfolio/Client Update:
The rally we were wanting to use to reduce risk into has failed to materialize outside of very large advances inside of a down day (Friday). As we said last week, such is not a good sign, and is something that has raised our overall “caution” levels markedly.
The market remains deeply oversold on a short-term basis and we continue to expect a rally this coming week in which we can reduce equity risk accordingly.
Please review the “Checklist Summary Of Actions To Take” in the main missive above. We will be applying this rules to our portfolios as well.
- New clients: We are holding OFF on-boarding into our portfolio models until a better risk/reward opportunity emerges.
- Equity Model: Multiple positions have violated stop-levels and will be sold on a rally next week.
- Equity/ETF blended – Same as with the equity model. Small and Mid-Caps were sold last week on absolute stop violations.
- ETF Model: Small and Mid-cap holdings were sold last week on absolute stop violations.
- Option-Wrapped Equity Model – If the market rallies back to previous resistance levels, we will add a long-dated S&P 5oo put option to portfolios to hedge risk.
As noted above in the main body of this missive, the violations of the market “this time” are markedly different than what we have seen previously. However, we do NOT want to panic if this is indeed just a correction within an ongoing bullish trend. The market HAS NOT violated the lows of February and earnings growth (while disappointing) is still growing. The pick up in volatility is certainly not enjoyable, but we don’t want to let our emotions get the better of our discipline.
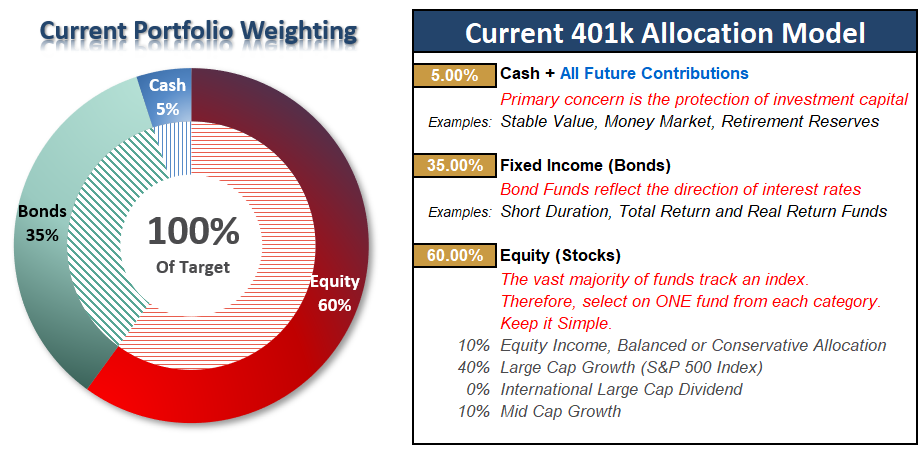
THE REAL 401k PLAN MANAGER
The Real 401k Plan Manager – A Conservative Strategy For Long-Term Investors
There are 4-steps to allocation changes based on 25% reduction increments. As noted in the chart above a 100% allocation level is equal to 60% stocks. I never advocate being 100% out of the market as it is far too difficult to reverse course when the market changes from a negative to a positive trend. Emotions keep us from taking the correct action.

Market Fails To Rally (Again)
As discussed at length in the main body of this missive, the market remains deeply oversold short-term. We expected we would get a sellable rally last week, but such was not to be. However, we continue to expect a rally given the deeply oversold conditions this coming week into which we will need to take some actions to reduce portfolio risk and raise cash.
As I noted last week:
“There are indeed some early indications that things have changed. However, with the markets VERY oversold, the best course of action going into next week is use ANY rally next week to make sure your 401k plans are balanced.”
Currently, we have our FIRST of FOUR sell-signals in place. The first signal is simply a ‘WARNING’ to pay attention to what is currently happening in the markets. Think of it as a ‘yellow flashing light’ at an intersection – slow down and be aware of your surroundings.”
We now have a confirmed “sell signal” which suggests more downward pressure on the markets going forward for now. However, we will wait for a reflexive rally to reduce equity risk into. The difference between this sell-off and that in February is that we have now broken the longer-term moving average.
Defense is now a primary strategy for 401k-plans.
- If you are overweight equities – reduce international and emerging market exposure on rallies. Bring portfolios in line to target weights if needed.
- If you are underweight equities – Hold for the moment.
- If you are at target equity allocations use rallies to rebalance risk in portfolios.
Unfortunately, 401k plans don’t offer a lot of flexibility and have trading restrictions in many cases. Therefore, we have to minimize our movement and try and make sure we are catching major turning points. Over the next couple of weeks, we will know for certain as to whether more changes need to be done to allocations as we head into the end of the year.
If you need help after reading the alert; don’t hesitate to contact me.
Current 401-k Allocation Model
The 401k plan allocation plan below follows the K.I.S.S. principle. By keeping the allocation extremely simplified it allows for better control of the allocation and a closer tracking to the benchmark objective over time. (If you want to make it more complicated you can, however, statistics show that simply adding more funds does not increase performance to any great degree.)
401k Choice Matching List
The list below shows sample 401k plan funds for each major category. In reality, the majority of funds all track their indices fairly closely. Therefore, if you don’t see your exact fund listed, look for a fund that is similar in nature.
