BY JOHN MAULDIN
The stock market is overvalued by many different measures.
I recently shared Dave Rosenberg’s thoughts on the subject. But at the SIC 2018 conference, we also heard a lot more from Steve Blumenthal, Mark Yusko, and several others. The evidence is adding up—and it’s not bullish, to say the least.
What drove valuations higher? There are many reasons, but the FAANG companies are primary.
Bulls Turn Bearish
Tech stocks—including all the FAANG names except Netflix—were 8 of the world’s 12 most valuable companies last year.
If several of these stocks start rolling over, the global bull market will be hard to sustain—and it’s already under assault for entirely different reasons, like rising interest rates, a potential trade war, and the overdue US recession.
It’s startling how fast the picture has changed.
As of December, many bulls thought tax cuts would spark enough activity to keep the economy growing into 2019 and beyond. That opinion is considerably less common today, including at the Federal Reserve.
Here’s the FOMC’s latest GDP projection, released just this week.
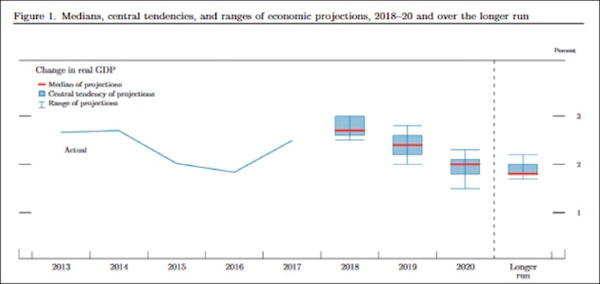
Source: FOMC
I’ve included this chart, but not because the FOMC members are great forecasters… they are clearly not. But this is what they think, and their thinking guides their rate decisions, which do have consequences.
They see real GDP growth rising to the 3% area this year before drifting back down to around 2% in the long run. And believing that, they still turned slightly more hawkish.
The Atlanta Fed’s GDPNow forecast is even more telling:
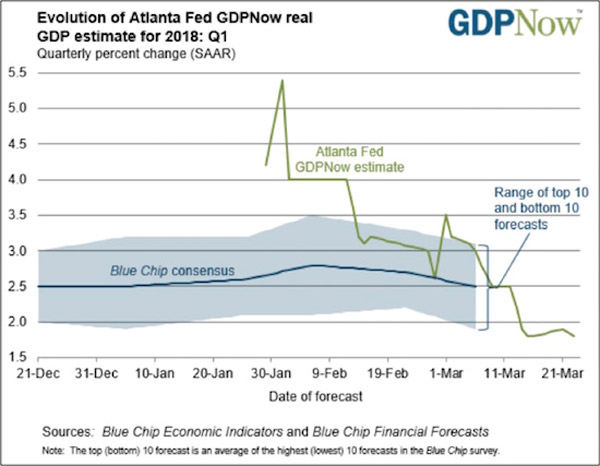
Less than two months ago, GDPNow was predicting almost 5.5% real GDP growth this quarter. From there, GDP growth has collapsed all the way to 1.8% as of March 23.
If the economy and markets are a mirror, we’re starting to see a bunch of cracks. The Bitcoin breakdown looks ominous in hindsight as possibly the first domino. Then we had the February VIX-driven correction, followed by trade worries, and now FAANG fears.
10 Recession Indicators
My good friend Steve Blumenthal used this chart from Ned Davis Research. Essentially, NDR looks at 10 recession indicators, each of which have varying levels of reliability. But by combining them in one overall index, you get a much better picture.
As of now, it says recession danger is relatively low for the next nine months.
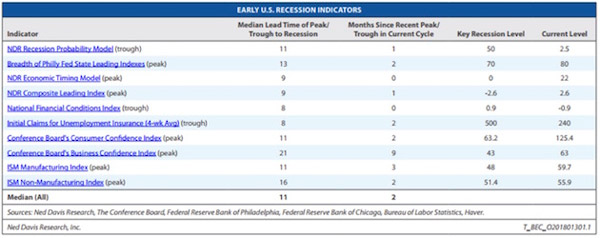
Source: Ned Davis Research
That said, the clear consensus from SIC 2018 was that the economy is likely to slow down, and the potential for a recession by mid-2019 is very real. A looming slowdown will hit corporate earnings and eventually stock prices.
Judging from February and then this week, we may already be entering that stage.