May left a mark.
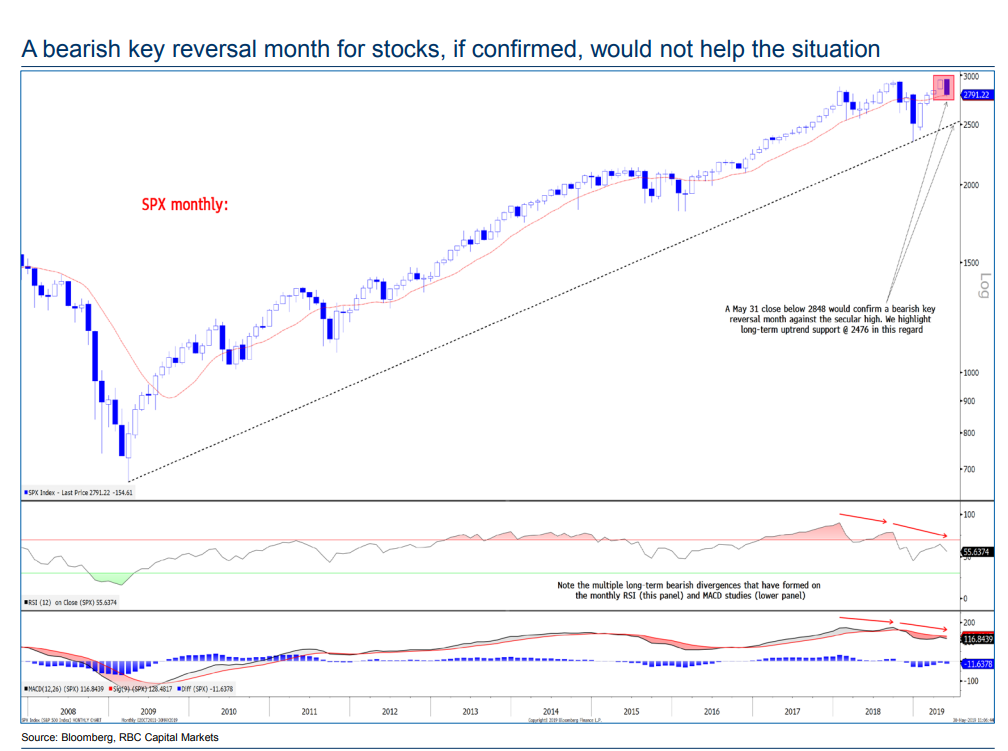
Even before heavy losses on Friday , the S&P 500 was on track to suffer a black eye on the monthly chart in the form of a “bearish key reversal.” That’s illustrated in the candlestick chart below, from a Thursday note by George Davis, chief technical strategist at RBC Capital Markets:

Key reversals are chart patterns that mark trend changes at extremes. A bearish pattern, which sees stocks close at a high in one period, extend that rise in the following period but then retreat to close below the previous period’s low.
Read: 7 key candlestick reversal patterns
To prevent the pattern, the S&P 500 SPX, -1.32% would have required a Friday close above the April low of 2,848. Instead, stocks fell sharpy following President Donald Trump’s threat to put escalating tariffs on all Mexican imports — a move that heightened worries over the outlook for economic growth and rattled global financial markets.