by Wolf Richter
China’s share surges to 54% in April. US in fourth Place, Canada an Also-Ran.
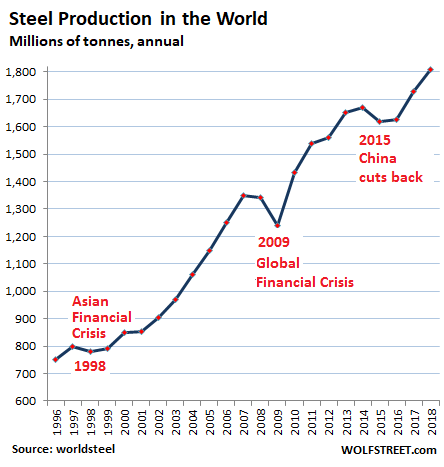
Global production of crude steel – ingots, semi-finished products (billets, blooms, slabs), and liquid steel for castings – rose 6.4% in April compared to April last year, to 156.7 million metric tonnes (Mt), according to the World Steel Association. Over the first four months of 2019, global production rose 4.8%, to 600 Mt.
In the banner-year 2018, production rose 4.5% to a record 1,808 Mt, having doubled since 2002. Since 1996, there have been only three episodes when annual crude steel production fell: 1998, as a consequence of the Asian Financial Crisis; 2009 as a consequence of the Global Financial Crisis; and 2015, when China made a brief effort to get out-of-control overproduction under control:
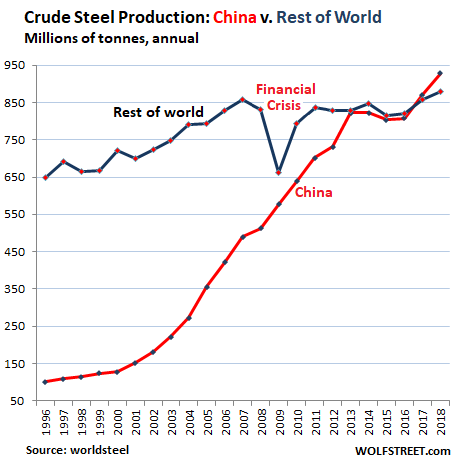
China v. the rest of the world:
In the year 2018, China alone produced 928 Mt of crude steel, up 6.6% up from 2017. This represented 51.3% of annual global production.
In the first four months of 2019, China’s crude steel production jumped 10.3% year-over-year to 315 Mt, bringing its share to 52.5% of global production.
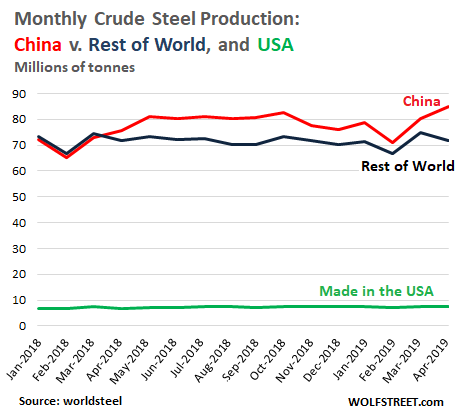
For April alone, China’s production soared 12.8% year-over-year to 85 Mt, and its share of global production reached 54.2%. That’s the new record.
The US, by comparison, the fourth largest crude steel producer, maintained its minuscule 4.7% share of global production over the 12-month period.
Vietnam, which in April moved up to 15th place, from 17th place for the year 2018, booked a huge jump of 42% in crude steel production in the first four months this year compared to 2018. For now, it’s still only a small producer with a share of less than 1% of global production.
In the rest of the world without China, production over the first four months in 2019 declined by 0.6% year-over-year.
The chart shows the monthly production of China (red) and the rest of the world (black), including the US in 2018 and 2019; in addition as a memo entry, just to see where we are, I added US production (green):
China’s steel production began surging out of near-nowhere in the late 1990s to end up outproducing the entire rest of the world, according to the data by the World Steel Association (worldsteel):
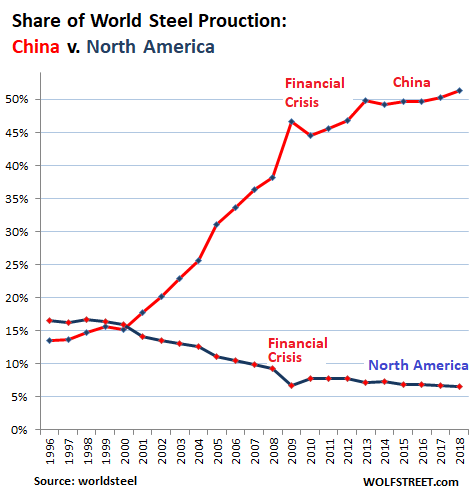
China’s mostly state-owned steel giants just kept on producing during the Financial Crisis, whether there was demand or not, causing prices to dive. Its market share jumped from 38% in 2008 to 47% in 2009. And its share has continued to grow. The chart below shows the global share of production in China and in North America (US, Canada, and Mexico):
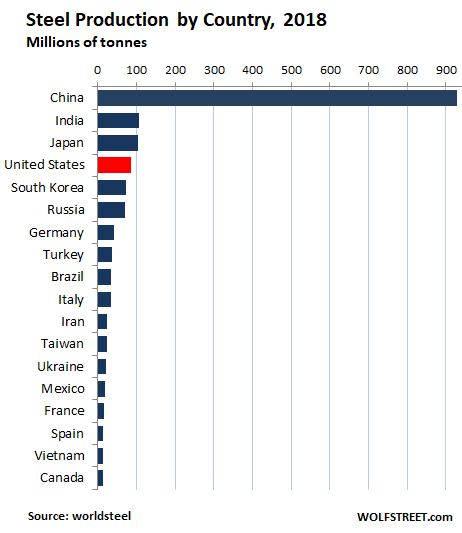
The largest crude steel producers in the world.
No country comes even close to China’s crude steel production. For example, its production is 11 times the amount produced in the US. But second and third place are just a hair apart. In 2017 India was in third place. In 2018, it moved into second place with 106.5 Mt., having outproduced Japan (104.3 Mt). The US is in fourth place (86.6 Mt). Canada is in 18th place:
Of the 15 companies that produced the largest quantity of crude steel in 2018, according to worldsteel, six are owned or controlled by government entities in China. The only US steelmaker on this list is Nucor in 12th place. In order of tonnage of crude steel:
- ArcelorMittal (96.4 Mt) – in 2006, India’s giant Mittal Steel acquired French giant Arcelor; now registered in Luxembourg as a mailbox company run from India.
- China Baowu Steel Group (67.4 Mt) – owned by the government of China.
- Nippon Steel Corporation, formerly Nippon Steel & Sumitomo Metal Corporation (49.2 Mt) – Japan.
- Hesteel Group, formerly HBIS Group (46.8 Mt) – owned by the government of Hebei Province, China. Also includes Serbia Iron & Steel d.o.o. Beograd and MAKSTIL A.D. in Macedonia
- POSCO (42.9 Mt) – South Korea.
- Shagang Group China (40.7 Mt) – privately owned, China.
- Anshan Iron and Steel Group, or Ansteel Group (37.4 Mt) – owned by the government of China.
- JFE Holdings (29.2 Mt) – Formed in 2002, when Japan’s second largest steelmaker NKK Corporation merged with Japan’s third largest steelmaker Kawasaki Steel.
- Jianlong Group (27.9 Mt) – privately owned, China
- Shougang Group (27.3 Mt) – owned by the government of Beijing, China.
- Tata Steel Group (27.3 Mt) – India.
- Nucor (25.5 Mt) – North Carolina, USA
- Shandong Steel (23.2 Mt) – owned by the government of Shandong province, China.
- Valin Group (23.0 Mt) – controlled by the Chinese state, with a minority of shares publicly traded
- Hyundai Steel Company (21.9 Mt) – South Korea
Chinese government-owned or controlled steelmakers have some advantages, such as no-matter-what funding from giant state-owned banks that are backed by the PBOC, and giant state-owned customers.
While China is by far the largest producer of crude steel, Chinese companies also used 1,712 Mt of crude steel in 2018, or 48.8% of global use, in the production of finished steel products for sale in China or for export. In other words, most of the steel that China exports is not crude steel but finished steel products.
Exports from China are a murky thing. To dodge tariffs, some of it gets transshipped via other countries, such as Vietnam, before the products are shipped to their destinations, such as the US or the EU, which has had tariffs on Chinese steel for years.