by
CLICK ON CHART TO ENLARGE
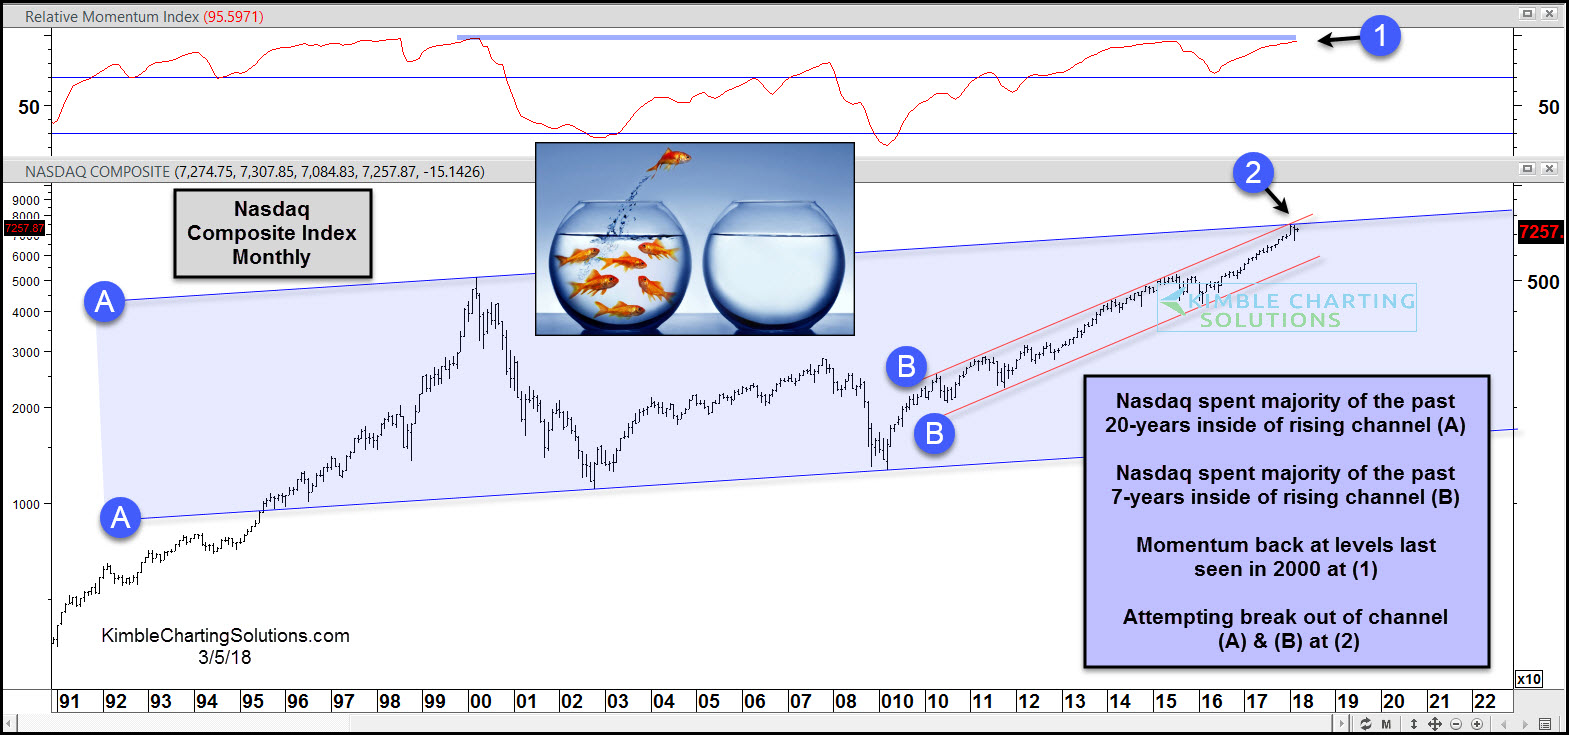
The chart above looks at the Nasdaq Composite Index over the past 27-years, on a monthly basis. The trend remains solidly up for tech, no doubt about it!
The index has spent the majority of the past 20-years inside of rising channel (A) and has spent the majority of the past 7-years inside of rising channel (A). The strong rally over the past 7-years has pushed momentum up to levels seldom seen at (1) above. Actually the last time it was this high was back in 2000.
Bulls would love to see Tech succeed and breakout above dual rising channels at (2).
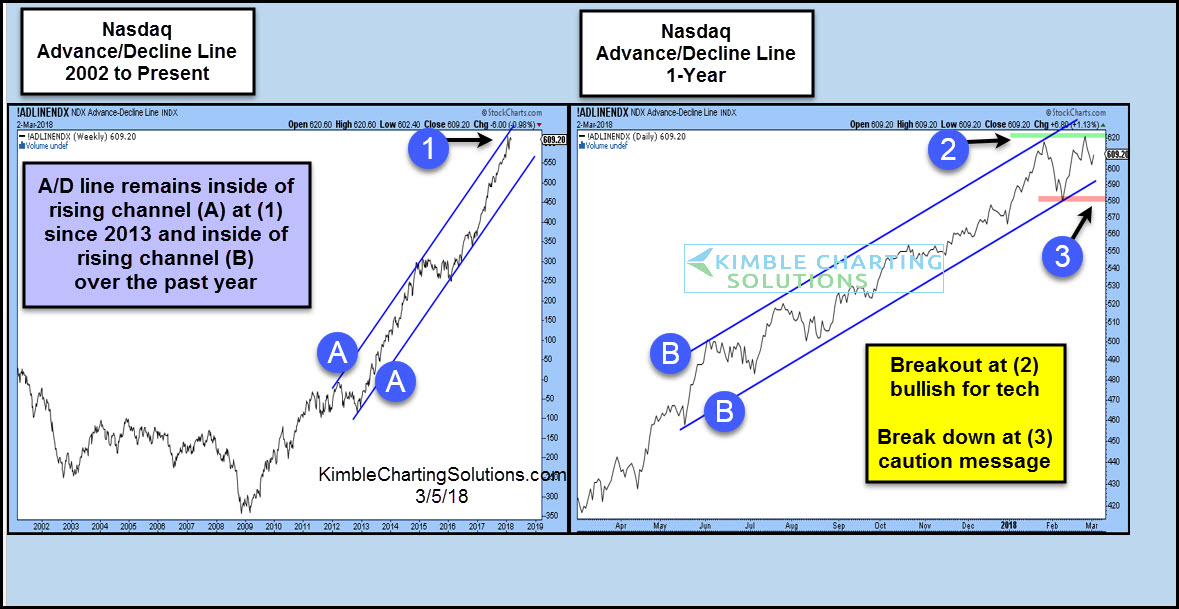
Below looks at the Advance/Decline line of the Nasdaq-
CLICK ON CHART TO ENLARGE
Without a doubt the trend of the A/D line is strong, sending a positive as it remains inside of long-term rising channel (A) and inside of 1-year rising channel (B).
Tech bulls want to see the A/D line breakout at (2) in the upper right chart and breakout above rising channel at (2) in the top chart.
Tech bulls do not want to see selling take place at (2) in the top chart nor the A/D line break support at (3).