by Dana Lyons
While stocks are finally back testing new all-time highs, the volatility market is well off of its yearly lows, a divergence that has been problematic for stocks the past 2 decades.
The S&P 500 (SPX) made its long-awaited (& much heralded) return to its January all-time highs this week. But while stocks are back at their highs, volatility expectations (specifically, the VIX, or S&P 500 Volatility Index) — which tend to trend in the opposite direction — remain well above their 52-week lows. Now, there are always bound to be divergences at new highs in the equity market — and, thus, divergences that matter very little, or none at all. However, the extent of the recent SPX/VIX divergence has got our attention.
Specifically, on Tuesday, the SPX touched a new all-time high (intraday). However, the VIX closed more than 40% above its 52-week closing low of 9.14 set last November. Over the last 20 years (actually 19-plus years), there have been just 3 other similar occurrences, though, the prior occurrences experienced clusters of such days. As the chart indicates, those prior occasions were very inauspicious times to investing in the stock market, to say the least.
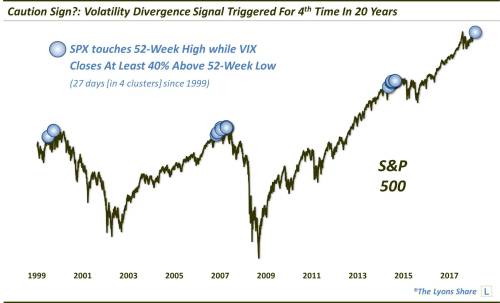
As one can see in the chart, the only other such divergences since mid-1999 came at the following junctures:
- December 1999-March 2000: Cyclical Top
- April-October 2007: Cyclical Top
- December 2014-February 2015: Major Intermediate-Term Top
We don’t have to tell you how poorly the equity market did following these periods, but we will…
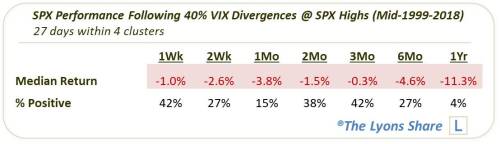
The long-term returns were the worst, especially the 1-year median return of -11.3%. Just 1 date (11/3/2014) saw a positive 1-year return and just 7 of the prior 26 saw a positive 6-month return. The short-term was also very weak with median 2-week and 1-month returns of -2.6% and -3.8%, respectively.
The intermediate-term saw a bit of a dead-cat bounce in some cases, mostly in December 1999, April-July 2007 and December 2014. That point highlights the fact that, while this signal has eventually been a warning sign for stocks, it has not necessarily been an immediate one. Indeed, the mere presence of clusters of signals around the aforementioned occurrences indicates that the first instance is not typically an immediate longer-term death knell for stocks. As tops are processes, we have seen these divergences take time to play out into negative ramifications during events in the past 19 years. However, overall, this divergence has been an extremely consistent and accurate warning sign eventually for stocks over the past 2 decades.
Now, along with the “cluster caveat”, we have another caveat to consider — the pre-1999 period. That’s because we observe a large sample of divergences occurring between 1987 and early-1999 that did not carry such negative consequences, at least not with the same consistency.
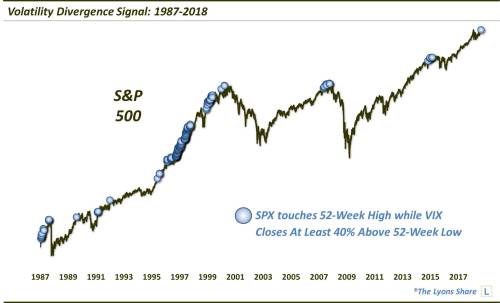
As the chart indicates, if we take the chart back another decade-plus, we observe an abundance of signals, particularly during the mid-1990’s, that accompanied mostly a rising stock market. There were a few good intermediate-term warning signs (that may be difficult to see), e.g., 1987, 1989, 1996, 1997, 1999. However, the majority of signals saw little to no ill-effects on the stock market.
The question is, are we currently in that mid to late-90’s melt-up stock market scenario, or more of the post-1999 environment. Our (strong) opinion is that we are in that latter market environment. Therefore, while this signal may just be the first of several clustered occurrences yet to come, our analysis would lead us to believe that this signal will indeed eventually have negative ramifications for the stock market.